7-Zip File Manager를 마우스 오른쪽 버튼으로 클릭하고, 팝업 메뉴에서 '관리자 권한으로 실행'을 눌러 관리자 권한으로 실행시킵니다.
7-Zip의 도구 모음에서 '도구'메뉴를 누르고, '옵션'을 선택합니다. 이제, '모두 선택'과 '적용'버튼을 차례로 클릭합니다.
2012년 4월 9일 월요일
2012년 2월 29일 수요일
Eclipse용 SVN(Subclipse) 업데이트 사이트
http://subclipse.tigris.org/servlets/ProjectProcess?pageID=p4wYuA
See the changelog for details. Existing Subclipse users should read the upgrade instructions for important information on changes you to need to make to your Eclipse preferences to see the new version in the update manager.
Subclipse 1.4.x includes and requires Subversion 1.5.x client features and working copy format.
Subclipse 1.6.x includes and requires Subversion 1.6.x client features and working copy format.
Subclipse 1.8.x includes and requires Subversion 1.7.x client features and working copy format.
Links for 1.8.x Release:
Changelog: http://subclipse.tigris.org/subclipse_1.8.x/changes.html
Eclipse update site URL: http://subclipse.tigris.org/update_1.8.x
Zipped downloads: http://subclipse.tigris.org/servlets/ProjectDocumentList?folderID=2240
Links for 1.6.x Release:
Changelog: http://subclipse.tigris.org/subclipse_1.6.x/changes.html
Eclipse update site URL: http://subclipse.tigris.org/update_1.6.x
Zipped downloads: http://subclipse.tigris.org/servlets/ProjectDocumentList?folderID=2240
Links for 1.4.x Release:
Changelog: http://subclipse.tigris.org/subclipse_1.4.x/changes.html
Eclipse update site URL: http://subclipse.tigris.org/update_1.4.x
Zipped downloads: http://subclipse.tigris.org/servlets/ProjectDocumentList?folderID=2240
서버 : http://blog.jidolstar.com/552 , http://kkamagui.springnote.com/pages/585605
서버 다운로드 : http://www.visualsvn.com/downloads/
클라이언트 : http://ioriy2k.pe.kr/archives/291
클라이언트 다운로드 : http://tortoisesvn.net/downloads.html
Current Release
Eclipse 3.2/Callisto, 3.3/Europa, 3.4/Ganymede, 3.5/Galileo, 3.6/Helios, 3.7/Indigo, +
Subclipse 1.8.5 and 1.6.18 and 1.4.8 are now available for Eclipse 3.2+!See the changelog for details. Existing Subclipse users should read the upgrade instructions for important information on changes you to need to make to your Eclipse preferences to see the new version in the update manager.
Subclipse 1.4.x includes and requires Subversion 1.5.x client features and working copy format.
Subclipse 1.6.x includes and requires Subversion 1.6.x client features and working copy format.
Subclipse 1.8.x includes and requires Subversion 1.7.x client features and working copy format.
Links for 1.8.x Release:
Changelog: http://subclipse.tigris.org/subclipse_1.8.x/changes.html
Eclipse update site URL: http://subclipse.tigris.org/update_1.8.x
Zipped downloads: http://subclipse.tigris.org/servlets/ProjectDocumentList?folderID=2240
Links for 1.6.x Release:
Changelog: http://subclipse.tigris.org/subclipse_1.6.x/changes.html
Eclipse update site URL: http://subclipse.tigris.org/update_1.6.x
Zipped downloads: http://subclipse.tigris.org/servlets/ProjectDocumentList?folderID=2240
Links for 1.4.x Release:
Changelog: http://subclipse.tigris.org/subclipse_1.4.x/changes.html
Eclipse update site URL: http://subclipse.tigris.org/update_1.4.x
Zipped downloads: http://subclipse.tigris.org/servlets/ProjectDocumentList?folderID=2240
서버 : http://blog.jidolstar.com/552 , http://kkamagui.springnote.com/pages/585605
서버 다운로드 : http://www.visualsvn.com/downloads/
클라이언트 : http://ioriy2k.pe.kr/archives/291
클라이언트 다운로드 : http://tortoisesvn.net/downloads.html
2012년 2월 23일 목요일
Purify - 미들웨어에서 호출한 서비스 적용방법
Purify를 통해서 미들웨어에서 호출된 서비스를 검증하는 방법은 대략 아래와 같습니다.
--------------------------------------------------
1> 서비스 원본의 복사본을 만듬, 례를 들어 서비스 파일이 sample_service라면 sample_service.nopure로 복사하여 저장함
2> Purify로 서비스 실행 파일 sample_service를 instrument 하여 sample_service.pure를 생성함, 례를 들면
# purify -verbose -log-file=/tmp/sample_service.purify.log -cache-dir=/tmp/purify-cache -always-use-cache-dir sample_service > verbose-log 2>&1
위에 커만드라인에 보이는 옵션들은 online 설명을 참고하시기 바랍니다.
3> Instrument한 서비스 파일sample_service.pure를 원본 서비스 파일 이름sample_service으로 바꿈
4> 미들웨어를 실행하여 서비스를 호출하고 서비스 기능들을 사용하시면 Purify가 데이터를 수집함
5> 미들웨어를 중지
6> 앞에 복사 저장한 sample_service.nopure 파일을 이용하여 서비스 파일을 원본으로 복원함
---------------------------------------------------
2012년 1월 31일 화요일
EGit 설치 및 사용자 가이드
- 설치
http://eclipse.org/egit/download/ 에 p2 repository를 이클립스 update site에 추가하여 설치를 합니다.
- 사용자 가이드
http://wiki.eclipse.org/EGit/User_Guide
2012년 1월 12일 목요일
TESTRT - TP.dll 또는 TP.so 사용법
* c/cpp 혼합인 경우에 쓸수 있는 환경변수
ATL_FORCE_C is off (default)
ATL_FORCE_CPLUSPLUS is off (default)
ATL_FORCE_C_TDP is off (default)
* tp.dll 또는 tp.so 등 공유라이브러리 사용시 쓸수 있는 환경변수
ATL_NO_TDP_COMPILE is off (default)
ATL_SHARED_TDP is off (default)
ATL_NO_TDP_COMPILE
If set, the Target Deployment Port Library is never compiled, even at link time
ATL_SHARED_TDP
If set and used in conjunction with ATL_NO_TDP_COMPILE, it must contain
the name of the shared library containing the TP.o[bj] file to be put
in place of TP.o[bj] on the link command line
1) attolcc를 사용하는 경우 예제
On Suse 7.2 or RedHat 7.2
cmd> attolcc -force_tdp_cc --cflags=-fPIC
cmd> ld -shared -rpath `pwd` TP.o -o TP.so
cmd> export ATL_NO_TDP_COMPILE=on
cmd> export ATL_SHARED_TDP=TP.so
cmd> attolcc -- cc -g -o toto toto.c
cmd> ldd ./toto
TP.so => TP.so (0x40018000)
libc.so.6 => /lib/libc.so.6 (0x40039000)
/lib/ld-linux.so.2 => /lib/ld-linux.so.2 (0x40000000)
On SuSe 8.0
cmd> attolcc -force_tdp_cc --cflags=-fPIC
cmd> ld -Wl,-rpath,. TP.o -o TP.so
cmd> export ATL_NO_TDP_COMPILE=on
cmd> export ATL_SHARED_TDP=TP.so
cmd> attolcc -- cc -g -o toto toto.c
cmd> ldd ./toto
TP.so => TP.so (0x40018000)
libc.so.6 => /lib/libc.so.6 (0x40039000)
/lib/ld-linux.so.2 => /lib/ld-linux.so.2 (0x40000000)
2) 일반적인 빌드 경우 예제 - 다소 옛날식...
[build.bat]
------------------------------------------------------------------------
del *.exe *.dll *.obj *.fdc *.tsf *.tpf *.tqf *.tdf *.tio *.spt *.pdb *.ilk *.lib *.idb *.exp Products.h
set CC=cl /MDd /Zi
set LD=link /INCREMENTAL:NO /debug
rem compil the dll sources
%CC% -c mydll.cpp
%CC% -c mydll2.cpp
rem generate the dll
%LD% /dll /machine:I386 /out:"mydll.dll" mydll.obj
%LD% /dll /machine:I386 /out:"mydll2.dll" mydll2.obj
rem compil the main application
%CC% -c example.c
rem link the main app with its dll
%LD% example.obj
rem run app without any instrumentation
example.exe
pause
del *.exe *.dll *.obj *.pdb *.ilk *.lib *.idb *.exp
rem do the same thing with instrumentation
set ATLTGT=%TESTRTDIR%\targets\cvisual6
set OPTIONS=-proc=ret -block=implicit -mempro
set CC=%ATLTGT%\cmd\attolcc %OPTIONS% -verbose -force_tdp_cc -- %CC% -DRTRT_RMDLL
set ATL_SHARED_TDP=TP.lib
set LD=%ATLTGT%\cmd\attolcc %OPTIONS% -verbose -force_tdp_cc -- %LD%
rem make the TP.dll
rem compil the dll sources and the TP thanks to -force_tdp_cc
%CC% -DRTRT_UNLOADABLE -DRTRT_RMDLL -c mydll.cpp
%CC% -DRTRT_UNLOADABLE -DRTRT_RMDLL -c mydll2.cpp
rem generate the TPdll.dll
del tp.obj
cl -c -DRTRT_RMDLL -I. "%ATLTGT%\lib\tpdll.cpp"
link /INCREMENTAL:NO /dll /debug /machine:I386 /out:"TP.dll" /implib:"TP.lib" TPdll.obj
rem generate the dll
%LD% /dll /machine:I386 /out:"mydll.dll" mydll.obj
%LD% /dll /machine:I386 /out:"mydll2.dll" mydll2.obj
rem compil the main application
%CC% -c example.c
rem link the main app with its dll
%LD% example.obj
rem run app with instrumentation
example.exe
atlsplit atlout.spt
rem studio *.fdc *.tsf *.tpf *.tqf *.tdf *.tio
------------------------------------------------------------------------
3) TestRT GUI이용시 예제
TestMyLib->Settings->Build->Target Deployment Port->TDP output format : Dynamic Libary
2012년 1월 9일 월요일
openSUSE - vmware-config-tools.pl 요구사항
1. Become root
2. Install gcc, kernel-source, kernel-syms, make, binutils
# yast2 --install gcc kernel-source kernel-syms make binutils
3. cd /usr/src/linux
4. make cloneconfig
5. make modules_prepare
That should generate the kernel-headers that /usr/bin/vmware-config-tools.pl requires.
Purify - 기본 사용법
출처 : http://www.ibm.com/developerworks/rational/library/06/0822_satish-giridhar/
Purify는 프로그램 실행 분석을 통해 프로그램에서 발생하는 메모리 에러를 탐지합니다. 프로그램의 적절한 위치에 추가코드를 삽입한 후 해당 프로그램의 실행을 통해 메모리에 대한 데이터 수집 및 검증을 수행합니다. 메모리 체크 실패시 해당 에러를 보고를 하며, 프로그램 종료시점에 메모리 누수 블럭에 대한 스캔을 수행합니다(물론 중간에 누수 스캔 요청을 할 수 있습니다).
Purify는 프로그램과 라이브러리 오브젝트 코드에 삽입을 합니다. 이 과정을 오브젝트 코드 삽입 object code instrumentation (OCI)이라 합니다. Purify는 오브젝트 코드에 삽입을 하며, 소스코드에 삽입하는 것이 아님을 알아두시기 바랍니다. 때문에 소스코드가 없는 써드파티 라이브러리에 대한 메모리 체크가 가능합니다.
여러분의 코드를 디버그 옵션으로 컴파일한다면, Purify는 디버그 정보를 활용하여 에러를 소스라인과 연계할 수 있으며, 에러 보고시에 관련 코드를 보여줄 수 있습니다. 디버그 정보를 포함하지 않는 부분에는, 에러를 오브젝트 코드 정보, 예를 들어 프로그램 카운터(PC), 명령어 등과 에러를 연계할 수 있습니다.
Purify는 메모리 사용 에러와 함께 함수 콜 체인 정보를 보고합니다. 써드파티 라이브러리에서 에러가 발생한 경우에도, 여러분의 소스코드로 부터 라이브러리에 있는 함수를 호출할겁니다. 그러므로 콜 체인에서 소스있는 디버그 정보를 통해 여러분의 코드 어느부분에서 해당 라이브러리 함수를 호출했는 지 파악할 수 있습니다. 이는 에러가 발생한 경우에 대한 귀중한 단서를 제공합니다. 이러한 정보로 부터, 에러가 여러분의 코드에서 발생한 것인지(예를 들어, 초기화하지 않은 인자를 라이브러리에 넘긴 경우) 아니면 써드파티 라이브러리에서 발생한 것인지(예를 들어 라이브러리에 초기화하지 않은 변수가 있는 경우)를 분석할 수 있습니다.
Purify는 다음 단계들과 관련있습니다:
삽입처리 과정은 윈도우즈와 유닉스 플랫폼 간 차이점이 있습니다. 플랫폼별 Purify에 대한 사용방법은 아래 내용을 참고합니다.
윈도우즈 플랫폼에서의 Purify 사용방법
윈도우즈 플랫폼에서, Purify를 사용하는 방법은 두가지 방법이 있습니다:
Purify는 "정밀" 에러체크를 위해서 Visual Studio의 디폴트 설정에서 만들지 않는 재배치 정보를 필요로 합니다. /fixed:no 와 /incremental:no 등의 링커 옵션을 사용하면 재배치 정보를 추가할 수 있습니다. 재배치 정보가 없는 경우, Purify는 "최소" 에러체크를 시행합니다.
프로그램에 대한 삽입처리 및 실행을 하기 위해, 먼저 Purify를 띄우고 아래 단계를 따릅니다:
Figure 1. Run Program dialog to instrument an executable program

Purify는 바이너리 파일을 삽입처리하고 프로그램을 실행합니다. Figure 2와 같이 프로그램 및 관련 라이브러리들에 대한 삽입처리 과정을 보여줍니다.
Figure 2. Instrumentation Progress of the executable and DLLs

삽입처리가 끝나면, 프로그램을 실행됩니다. 실행 중, Purify는 탐지한 메모리 엑세스 에러를 보고합니다. 말미에, Purify는 메모리 누수에 대한 보고를 합니다. Figure 3에서 처럼 Purify 에러와 누수 보고서를 보여줍니다.
Figure 3. Memory errors found by Purify (on Windows)

Purify는 에러, 경고, 메모리 누수에 대한 요약 등을 보고합니다. 에러를 클릭하면, 통계, 스택 추적, 라인 번호 등 자세한 정보를 알수있습니다. 예를 들어, array bounds read (ABR) 에러를 클릭하면, 에러 위치와 메모리 할당 위치를 볼수 있습니다(Figure 4). 에러 위치의 소스코드를 보면, ABR 에러가 memerrors.c 파일의 100번째 라인 즉, 스트링 str이 printf 함수로 전달되는 라인에서 발생했습니다. printf 함수는 스트링 str을 NULL바이트를 만날때까지 처리합니다. 여기서는 printf 함수 호출 전에, name으로 부터 10바이트를 str로 복사를 했고, str[11]에 NULL을 설정하여 스트링을 끝처리 했습니다. 그래서 printf는 필시 11 바이트를 읽게 되었습니다. 메모리 할당 위치를 보면, memerrors.c 파일의 107 라인에서 str은 10개의 문자를 갖도록 할당되었습니다. 이를 종합해 보면, str[11]은 배열의 범위 밖을 엑세스하게 되어, array bounds read (ABR) 에러가 발생한 것입니다. 이는 NULL 문자열 끝처리와 배열의 크기에 관련된 오해에서 비롯된 전형적인 에러입니다.
Figure 4. Details of ABR error including source code and line number information (on Windows)

Purify가 보고한 각각의 에러를 조사합니다. Purify가 제공한 상세한 정보의 도움을 받아, 에러에 대한 디버그와 수정작업을 합니다. 결함 수정 후에는 다시 Purify를 실행하여 에러가 없다는 것을 검증합니다.
Purify는 다양한 맞춤 설정 옵션을 통해서 여러분의 요구에 맞는 분석 유형에 탄력적으로 대응합니다. 여러분이 수정할 수 없는 써드파티 라이브러리에서 발생하는 에러를 보고에서 억제하는 방법 또한 제공합니다.
아래 단계는 윈도우즈 플랫폼에서 UMC 에러, 그와 관련된 스택 변수를 명시하기 위한 단계를 제시합니다:
Figure 5. Tick the Checkbox "Show UMC messages" in the Settings dialog (on Windows)

Figure 6. Additional options to check UMR errors on stack variables (on Windows)

여러분은 필터를 정의하여 관심없는 에러 보고를 억제할 수 있습니다. Purify 좌측 영역에서, Run을 우클릭하고 Filter Manager 대화상자를 선택합니다 (Figure 7). Purify는 특정 에러 유형, 특정 콜 스택상의 또는 특정 라이브러리의 에러에 대한 억제할 수 있는 기능을 제공합니다.
Figure 7. Invoking Filter Manager to suppress uninteresting errors (on Windows)

Purify 기능에 관련된 자세한 내용은 Help 메뉴을 참고합니다.
유닉스/리눅스 플랫폼에서의 Purify 사용방법
UNIX 플랫폼상에서는 프로그램을 삽입처리하는 다양한 방법이 있습니다. 가장 간단한 방법은 프로그램 빌드하는 커맨드라인에 purify를 접두어로 추가하는 방법입니다.
예를 들어, 아래와 같이 memerrors.c (Download 참조)파일을 빌드하여 a.out를 생성합니다:
ksh% cc -g memerrors.c
여기에 purify를 접두어로 추가시키면, 삽입처리된 a.out을 빌드합니다:
ksh% purify cc -g memerrors.c
만약 Makefile를 이용해 프로그램을 빌드한다면, 삽입처리용 빌드타겟을 추가할 수 있습니다:
a.out: foo.c bar.c
$(CC) $(FLAGS) -o $@ $?
a.out.pure: foo.c bar.c
purify $(CC) $(FLAGS) -o $@ $?
빌드 타켓을 복사하는 경우 아래 두가지 변경만이 필요합니다 (위의 a.out의 경우):
삽입처리는 모든 플랫폼에서 링크시에 실행됩니다. AIX에서는, 실행파일에 바로 삽입처리를 적용할 수 있습니다:
ksh% purify a.out
아래는 AIX에서 memerrors.c 파일을 컴파일, 삽입처리, 실행시 로그를 보여줍니다:
삽입처리된 프로그램을 실행하면 Purify GUI는 메모리 에러를 탐지하면 바로 나타냅니다(Figure 8).
Figure 8. Memory errors found by Purify (on UNIX)

에러를 클릭하면 자세한 정보를 얻을 수 있습니다. Figure 9는 ABR 에러에 대한 자세한 정보를 보여줍니다. 이 정보로 부터 memerrors.c의 107번째 라인에서 NULL 처리된 str 메모리를 할당받았다는 것을 알수 있습니다. 하지만 genABRandABW에서 잘못 계산한 까닭에, name 스트림을 str로 복사한 후에, NULL 바이트가 str[11]에 저장되었습니다. 이로 인해 printf가 str의 범위 밖을 읽게되어 array bounds read (ABR) 에러가 110번째 라인에서 발생했습니다.
Figure 9. Details of ABR errors, including source code and line number information (on UNIX)

유닉스 및 리눅스 시스템상에서 Purify는 모든 UMC 에러와 관련된 스택변수를 추적합니다. 디폴트로 해당 에러는 억제되어 있습니다. 억제된 에러를 보려면 View > Suppressed messages (Figure 10)를 선택합니다.
Figure 10. Seeing suppressed errors (on UNIX)

관심없는 에러 보고를 억제하는 방법은 간단합니다. 에러유형을 선택하고 우클릭후 Suppress 메뉴를 선택합니다(Figure 11).
Figure 11. Suppressing an error (on UNIX)

Purify 기능에 대한 자세한 정는 Help 메뉴를 사용합니다.
Purify는 프로그램 실행 분석을 통해 프로그램에서 발생하는 메모리 에러를 탐지합니다. 프로그램의 적절한 위치에 추가코드를 삽입한 후 해당 프로그램의 실행을 통해 메모리에 대한 데이터 수집 및 검증을 수행합니다. 메모리 체크 실패시 해당 에러를 보고를 하며, 프로그램 종료시점에 메모리 누수 블럭에 대한 스캔을 수행합니다(물론 중간에 누수 스캔 요청을 할 수 있습니다).
Purify는 프로그램과 라이브러리 오브젝트 코드에 삽입을 합니다. 이 과정을 오브젝트 코드 삽입 object code instrumentation (OCI)이라 합니다. Purify는 오브젝트 코드에 삽입을 하며, 소스코드에 삽입하는 것이 아님을 알아두시기 바랍니다. 때문에 소스코드가 없는 써드파티 라이브러리에 대한 메모리 체크가 가능합니다.
여러분의 코드를 디버그 옵션으로 컴파일한다면, Purify는 디버그 정보를 활용하여 에러를 소스라인과 연계할 수 있으며, 에러 보고시에 관련 코드를 보여줄 수 있습니다. 디버그 정보를 포함하지 않는 부분에는, 에러를 오브젝트 코드 정보, 예를 들어 프로그램 카운터(PC), 명령어 등과 에러를 연계할 수 있습니다.
Purify는 메모리 사용 에러와 함께 함수 콜 체인 정보를 보고합니다. 써드파티 라이브러리에서 에러가 발생한 경우에도, 여러분의 소스코드로 부터 라이브러리에 있는 함수를 호출할겁니다. 그러므로 콜 체인에서 소스있는 디버그 정보를 통해 여러분의 코드 어느부분에서 해당 라이브러리 함수를 호출했는 지 파악할 수 있습니다. 이는 에러가 발생한 경우에 대한 귀중한 단서를 제공합니다. 이러한 정보로 부터, 에러가 여러분의 코드에서 발생한 것인지(예를 들어, 초기화하지 않은 인자를 라이브러리에 넘긴 경우) 아니면 써드파티 라이브러리에서 발생한 것인지(예를 들어 라이브러리에 초기화하지 않은 변수가 있는 경우)를 분석할 수 있습니다.
Purify는 다음 단계들과 관련있습니다:
- 디버그 옵션으로 여러분의 코드를 컴파일합니다
- Purify를 이용해 바이너리에 오브젝트 코드를 삽입합니다
- 삽입처리된 프로그램을 실행합니다
- Purify가 보고한 에러를 조사하고 수정합니다
삽입처리 과정은 윈도우즈와 유닉스 플랫폼 간 차이점이 있습니다. 플랫폼별 Purify에 대한 사용방법은 아래 내용을 참고합니다.
윈도우즈 플랫폼에서의 Purify 사용방법
윈도우즈 플랫폼에서, Purify를 사용하는 방법은 두가지 방법이 있습니다:
- 첫번째 방법: Purify를 Microsoft® Visual Studio® IDE에 통합 설치를 하고, Purify 연계 또는 비연계를 버튼으로 지정할 수 있습니다. Purify를 연계한 경우, 프로젝트 빌드를 하면, Purify는 자동으로 빌드하는 실행파일에 삽입처리를 합니다. 해당 프로그램을 실행하면, Purify의 에러체크 코드가 실행되고 IDE에 에러를 메모리사용 통계와 함께 보고합니다.
- 두번째 방법: Purify GUI를 사용하여 프로그램 삽입처리 및 다양한 삽입처리 옵션 설정을 합니다. 삽입처리된 프로그램을 실행하면, Purify GUI 내 윈도우에 에러를 표시합니다. 아래에서는 프로그램 삽입처리, 삽입처리된 프로그램 실행, 보고된 에러조사 등의 단계에 대해 기술합니다.
Purify는 "정밀" 에러체크를 위해서 Visual Studio의 디폴트 설정에서 만들지 않는 재배치 정보를 필요로 합니다. /fixed:no 와 /incremental:no 등의 링커 옵션을 사용하면 재배치 정보를 추가할 수 있습니다. 재배치 정보가 없는 경우, Purify는 "최소" 에러체크를 시행합니다.
프로그램에 대한 삽입처리 및 실행을 하기 위해, 먼저 Purify를 띄우고 아래 단계를 따릅니다:
- memerrors.c 파일 (Download 참조)을 디버그옵션을 이용해 컴파일하고 실행 프로그램을 생성합니다.
- File > Run을 선택하여 Run Program 대화상자 (Figure 1) 를 띄웁니다.
- Program name 상자에 실행 파일 경로를 지정합니다.
- Collect 옵션에서 Error and leak data 선택 버튼을 클릭합니다.
- 프로그램 실행 후에도 콘솔을 유지하기 위해 Pause console after exit 체크 박스를 선택합니다.
- (옵션) Settings를 클릭하여 Purify 설정을 변경합니다.
- Run을 클릭합니다.
Figure 1. Run Program dialog to instrument an executable program
Purify는 바이너리 파일을 삽입처리하고 프로그램을 실행합니다. Figure 2와 같이 프로그램 및 관련 라이브러리들에 대한 삽입처리 과정을 보여줍니다.
Figure 2. Instrumentation Progress of the executable and DLLs
삽입처리가 끝나면, 프로그램을 실행됩니다. 실행 중, Purify는 탐지한 메모리 엑세스 에러를 보고합니다. 말미에, Purify는 메모리 누수에 대한 보고를 합니다. Figure 3에서 처럼 Purify 에러와 누수 보고서를 보여줍니다.
Figure 3. Memory errors found by Purify (on Windows)
Purify는 에러, 경고, 메모리 누수에 대한 요약 등을 보고합니다. 에러를 클릭하면, 통계, 스택 추적, 라인 번호 등 자세한 정보를 알수있습니다. 예를 들어, array bounds read (ABR) 에러를 클릭하면, 에러 위치와 메모리 할당 위치를 볼수 있습니다(Figure 4). 에러 위치의 소스코드를 보면, ABR 에러가 memerrors.c 파일의 100번째 라인 즉, 스트링 str이 printf 함수로 전달되는 라인에서 발생했습니다. printf 함수는 스트링 str을 NULL바이트를 만날때까지 처리합니다. 여기서는 printf 함수 호출 전에, name으로 부터 10바이트를 str로 복사를 했고, str[11]에 NULL을 설정하여 스트링을 끝처리 했습니다. 그래서 printf는 필시 11 바이트를 읽게 되었습니다. 메모리 할당 위치를 보면, memerrors.c 파일의 107 라인에서 str은 10개의 문자를 갖도록 할당되었습니다. 이를 종합해 보면, str[11]은 배열의 범위 밖을 엑세스하게 되어, array bounds read (ABR) 에러가 발생한 것입니다. 이는 NULL 문자열 끝처리와 배열의 크기에 관련된 오해에서 비롯된 전형적인 에러입니다.
Figure 4. Details of ABR error including source code and line number information (on Windows)
Purify가 보고한 각각의 에러를 조사합니다. Purify가 제공한 상세한 정보의 도움을 받아, 에러에 대한 디버그와 수정작업을 합니다. 결함 수정 후에는 다시 Purify를 실행하여 에러가 없다는 것을 검증합니다.
Purify는 다양한 맞춤 설정 옵션을 통해서 여러분의 요구에 맞는 분석 유형에 탄력적으로 대응합니다. 여러분이 수정할 수 없는 써드파티 라이브러리에서 발생하는 에러를 보고에서 억제하는 방법 또한 제공합니다.
아래 단계는 윈도우즈 플랫폼에서 UMC 에러, 그와 관련된 스택 변수를 명시하기 위한 단계를 제시합니다:
- Run Program 대화상자(Figure 1)에서 Settings를 클릭합니다.
- Errors and Leaks 탭에서 Show UMC messages (Figure 5)를 체크합니다.
- Files 탭에서 Additional options 박스 (Figure 6)에 -stack-load-checking을 입력하여, Purify가 스택변수에 UMR 에러를 체크하도록 합니다.
- OK를 클릭하고 Run을 클릭합니다.
- Purify가 실행하면 UMC 메모리 사용 에러를 보고합니다(Figure 3).
Figure 5. Tick the Checkbox "Show UMC messages" in the Settings dialog (on Windows)
Figure 6. Additional options to check UMR errors on stack variables (on Windows)
여러분은 필터를 정의하여 관심없는 에러 보고를 억제할 수 있습니다. Purify 좌측 영역에서, Run을 우클릭하고 Filter Manager 대화상자를 선택합니다 (Figure 7). Purify는 특정 에러 유형, 특정 콜 스택상의 또는 특정 라이브러리의 에러에 대한 억제할 수 있는 기능을 제공합니다.
Figure 7. Invoking Filter Manager to suppress uninteresting errors (on Windows)
Purify 기능에 관련된 자세한 내용은 Help 메뉴을 참고합니다.
유닉스/리눅스 플랫폼에서의 Purify 사용방법
UNIX 플랫폼상에서는 프로그램을 삽입처리하는 다양한 방법이 있습니다. 가장 간단한 방법은 프로그램 빌드하는 커맨드라인에 purify를 접두어로 추가하는 방법입니다.
예를 들어, 아래와 같이 memerrors.c (Download 참조)파일을 빌드하여 a.out를 생성합니다:
ksh% cc -g memerrors.c
여기에 purify를 접두어로 추가시키면, 삽입처리된 a.out을 빌드합니다:
ksh% purify cc -g memerrors.c
만약 Makefile를 이용해 프로그램을 빌드한다면, 삽입처리용 빌드타겟을 추가할 수 있습니다:
a.out: foo.c bar.c
$(CC) $(FLAGS) -o $@ $?
a.out.pure: foo.c bar.c
purify $(CC) $(FLAGS) -o $@ $?
빌드 타켓을 복사하는 경우 아래 두가지 변경만이 필요합니다 (위의 a.out의 경우):
- 빌드 타겟 이름을 변경합니다 (a.out.pure).
- 빌드 타켓 커맨드에 purify를 접두어로 추가합니다.
삽입처리는 모든 플랫폼에서 링크시에 실행됩니다. AIX에서는, 실행파일에 바로 삽입처리를 적용할 수 있습니다:
ksh% purify a.out
아래는 AIX에서 memerrors.c 파일을 컴파일, 삽입처리, 실행시 로그를 보여줍니다:
ksh % cc -g memerrors.c ksh % purify a.out Purify 7.0 AIX (32-bit) (C) Copyright IBM Corporation. 1992, 2006 All Rights Reserved. Instrumenting: a.out. libc.a,,,,,,,,,,,,,,,,,,,,,,,,,,,,,,,,,,,,,,,,,,,,,,,,,,,,,, ,,,,,,,,,,,,,,,,,,,,,,,,,,,,,,.......,,,,, libcrypt.a., Instrumented a.out is a.out.pure. Done. ksh % ./a.out.pure |
삽입처리된 프로그램을 실행하면 Purify GUI는 메모리 에러를 탐지하면 바로 나타냅니다(Figure 8).
Figure 8. Memory errors found by Purify (on UNIX)
에러를 클릭하면 자세한 정보를 얻을 수 있습니다. Figure 9는 ABR 에러에 대한 자세한 정보를 보여줍니다. 이 정보로 부터 memerrors.c의 107번째 라인에서 NULL 처리된 str 메모리를 할당받았다는 것을 알수 있습니다. 하지만 genABRandABW에서 잘못 계산한 까닭에, name 스트림을 str로 복사한 후에, NULL 바이트가 str[11]에 저장되었습니다. 이로 인해 printf가 str의 범위 밖을 읽게되어 array bounds read (ABR) 에러가 110번째 라인에서 발생했습니다.
Figure 9. Details of ABR errors, including source code and line number information (on UNIX)
유닉스 및 리눅스 시스템상에서 Purify는 모든 UMC 에러와 관련된 스택변수를 추적합니다. 디폴트로 해당 에러는 억제되어 있습니다. 억제된 에러를 보려면 View > Suppressed messages (Figure 10)를 선택합니다.
Figure 10. Seeing suppressed errors (on UNIX)
관심없는 에러 보고를 억제하는 방법은 간단합니다. 에러유형을 선택하고 우클릭후 Suppress 메뉴를 선택합니다(Figure 11).
Figure 11. Suppressing an error (on UNIX)
Purify 기능에 대한 자세한 정는 Help 메뉴를 사용합니다.
Purify - Daily 빌드 및 테스트과의 연계
출처 : http://www.ibm.com/developerworks/rational/library/08/0513_gupta-gaurav/index.html
Purify is a very useful tool throughout the software development life cycle.
Because the cost of detecting and fixing a defect is least during early phases of the software development life cycle, it is best to catch and fix as many issues as possible during development and testing phases. You can achieve that ideal by methodical and systematic use of Purify throughout the software development life cycle. The best way to accomplish this is by automating the use of Purify and integrating it into your software development and testing process.
Automation of a tool eliminates the overhead and makes it effortless to use, which in turn reduces the resistance to its adoption as part of the process. Thus, automation is the key in streamlining the process. For example, you can integrate Purify with your unit or smoke test suite that developers must run before checking in any code changes and require them to fix any new memory errors reported by Purify. In this way, an error is caught as soon as it is introduced and fixed easily, because the code changes are still fresh in the developer's mind. Similarly, you can integrate Purify with your functional and system verification test suite, which you might be running nightly or weekly. Testers can analyze and file defect reports for memory errors reported by Purify. This ensures that new memory errors are caught within a day or a week from the time that they were introduced, which is much better than catching them after releasing the software.
You can learn about using Purify and integrating it into your build
Incorporating Purify into your build and test environment
The first step in integrating Purify into your software development and testing process is to modify your build and test system. The build system builds an application and the test system runs the application with a test suite (shown in blue in Figure 1). Typically, the process of building the application and running the test suite is automated and scheduled as nightly or weekly jobs.
You need to modify your build system to build a Purify'd application along with the normal application. Normally, you will be building the application without having any debug information (release bits). For building a Purify'd application, it is advisable (although not required) to build the application with debug information (debug bits), and then purify it.
You also need to modify your test system to run the test suite with the Purify'd application, in addition to running it with the normal application. These additional build and test steps are shown in green in Figure 1. After making these changes, add building the Purify'd application and running it with your test suite to your automated nightly or weekly jobs. Later in this article, you will learn about various ways of controlling and automating the actions to be taken when Purify detects memory errors or leaks.
Figure 1. Modifications in the build and the test systems

Using conversion symbols
Purify provides various conversion symbols that you can use to specify values for various options, such as
This command will create an instrumented executable named progname. If you run this, and the process ID for that run is 1234, all Purify errors will be logged in a file named purifyerrors_progname_1234.plog. In the log file name, Purify expands
Adding operations after a Purify run
Automating what happens before running your instrumented application is easy, because you have all of the controls. You can control and automate what happens after running the application by exploiting various Purify features that let you add custom post-processing tasks. Purify enables you to run a script after exiting the instrumented application. You can use this to report a summary of all of the errors reported after the instrumented program exits. To do this, you use the Purify
For example, if your instrumented application is
The string that follows the
This is a simple example. However, you can put complex processing into a script, or even in a program, and pass various conversion symbols as arguments to the script or program. For example:
Table 1 and Table 2 show more details of the substitution strings for conversion symbols.
Table 1. Conversion symbols that can be used with Purify options
Table 2. Conversion symbols that can be used in Exit-command (-run-at-exit)
Using program exit status
You have already learned how to run your scripts at the end of instrumented program run. Purify also gives you some information through its exit status. By default, Purify does not modify the normal exit status of your program. However, you can choose to have your program exit with a special exit status if Purify finds any access errors or memory leaks. This is a convenient way to flag failing runs in test suites. Use the
Listing 1 is an example that exploits the
Listing 1. Exit status option example
The exit value is not 0 (zero), as returned in function
If you want your instrumented application to exit upon detecting the first error, you can use the
Mailing Purify results and assisting analysis
Purify has a
When you run the
Sometimes, while analyzing the errors, it is useful to look at not only the function names but also other details, such as the complete path of the file where it is located or the PC values. You can enable Purify to display such information by using these options:
In this section, you will see an example that uses most of the options that you learned about in this article. Listing 2 shows the
Purify runtime options are set before running the test. For the
Listing 2. GNUMakefile with modified build and test systems
The
Listing 3.Content of the addsummary.sh shell script
Figure 2 shows the HTML page generated after three runs of the test suite. Each run is represented by a row, and each row has a hyperlink to the Purify log file. Each successive run of the test suite will add a new row at the beginning of the table.
Figure 2. Purify Test Summary report in the browser

Summary
As this article explains, you get maximum benefits when you use Purify regularly and systematically. You now know how to incorporate Purify into your software development and testing process and to automate its use with the help of conversions symbols and options.
Although the example used in this article is simple, it demonstrates how easy it is to integrate Purify into your build and test environment and the value of automating Purify usage. Think about the simplicity of checking the Purify test results summary on a Web page that gets updated automatically every time your test suite is executed. All existing log files are also accessible through the same Web page. The example here is intentionally simple, just to show you the possibilities. You can create a quite sophisticated system that compares results and sends e-mail notifications with precise details upon finding any additional memory errors and leaks. You can fix them as soon as they are introduced. With this knowledge, you are ready to reap the maximum benefits of Rational Purify.
Purify is a very useful tool throughout the software development life cycle.
- Developers can use it to ensure that the new code that they have written is not going to inadvertently cause any memory corruption errors or leaks.
- Test engineers can use it to catch memory errors during functional verification and system integration testing.
- And field and support engineers can use it to diagnose memory issues encountered after the software has been deployed.
Because the cost of detecting and fixing a defect is least during early phases of the software development life cycle, it is best to catch and fix as many issues as possible during development and testing phases. You can achieve that ideal by methodical and systematic use of Purify throughout the software development life cycle. The best way to accomplish this is by automating the use of Purify and integrating it into your software development and testing process.
Automation of a tool eliminates the overhead and makes it effortless to use, which in turn reduces the resistance to its adoption as part of the process. Thus, automation is the key in streamlining the process. For example, you can integrate Purify with your unit or smoke test suite that developers must run before checking in any code changes and require them to fix any new memory errors reported by Purify. In this way, an error is caught as soon as it is introduced and fixed easily, because the code changes are still fresh in the developer's mind. Similarly, you can integrate Purify with your functional and system verification test suite, which you might be running nightly or weekly. Testers can analyze and file defect reports for memory errors reported by Purify. This ensures that new memory errors are caught within a day or a week from the time that they were introduced, which is much better than catching them after releasing the software.
You can learn about using Purify and integrating it into your build
makefiles in the article: Navigating C in a leaky boat?
Try Purify. If you are already familiar with Purify, you can skip or skim that
article. In this article, you will first learn how to change your build and test
environment to incorporate Purify into it and about conversions symbols that you
can use with Purify options to automate using Purify. Then you will see an example
where all of these capabilities are exploited to automate reporting a summary of
Purify errors on a Web page.Incorporating Purify into your build and test environment
The first step in integrating Purify into your software development and testing process is to modify your build and test system. The build system builds an application and the test system runs the application with a test suite (shown in blue in Figure 1). Typically, the process of building the application and running the test suite is automated and scheduled as nightly or weekly jobs.
You need to modify your build system to build a Purify'd application along with the normal application. Normally, you will be building the application without having any debug information (release bits). For building a Purify'd application, it is advisable (although not required) to build the application with debug information (debug bits), and then purify it.
You also need to modify your test system to run the test suite with the Purify'd application, in addition to running it with the normal application. These additional build and test steps are shown in green in Figure 1. After making these changes, add building the Purify'd application and running it with your test suite to your automated nightly or weekly jobs. Later in this article, you will learn about various ways of controlling and automating the actions to be taken when Purify detects memory errors or leaks.
Figure 1. Modifications in the build and the test systems
Using conversion symbols
Purify provides various conversion symbols that you can use to specify values for various options, such as
-view-file
and
-log-file
(these options send Purify output
to a Purify view file and to an ASCII log file, respectively). Purify replaces
these symbols by meaningful expansions and computes a unique file name for saving
data. For example, you can put the program name and process ID in the name of log
file: $ purify -log-file=./purifyerrors_%v_%p.plog cc -o progname foo.c bar.c
|
This command will create an instrumented executable named progname. If you run this, and the process ID for that run is 1234, all Purify errors will be logged in a file named purifyerrors_progname_1234.plog. In the log file name, Purify expands
%v to the program executable name and the
%p to the process ID.Adding operations after a Purify run
Automating what happens before running your instrumented application is easy, because you have all of the controls. You can control and automate what happens after running the application by exploiting various Purify features that let you add custom post-processing tasks. Purify enables you to run a script after exiting the instrumented application. You can use this to report a summary of all of the errors reported after the instrumented program exits. To do this, you use the Purify
-run-at-exit
runtime option.
For example, if your instrumented application is
test.pure, you can use this option as follows to print
a summary of errors found:$ setenv PURIFYOPTIONS '-run-at-exit="if %z ; then \
echo \"%v : %e errors, %l bytes leaked.\" ; fi"'
|
The string that follows the
-run-at-exit
option
is executed by the shell after the program exits. Conversion symbol substitutions are made, such as
turning %z into false if
there were no Purify errors or leaks during the run. Because of that, the
if statement in this example says: "Execute
the 'echo' only if there were errors." The
echo command, in turn, uses more substitution strings
to report how many errors there were. Upon exiting the program, Purify sends a
message similar to one:$ test.pure
test.pure : 2 errors, 10 bytes leaked
|
This is a simple example. However, you can put complex processing into a script, or even in a program, and pass various conversion symbols as arguments to the script or program. For example:
$ setenv PURIFYOPTIONS '-run-at-exit="postprocess.csh %v %z %e %l "'
|
Table 1 and Table 2 show more details of the substitution strings for conversion symbols.
Table 1. Conversion symbols that can be used with Purify options
| Character | Converts to |
|---|---|
| %v | Program executable name, lowercase V (name of the instrumented executable that you are running) |
| %V | Full path name of the program, uppercase V (/ replaced by _) |
| %p | Process ID (pid or PID) |
Table 2. Conversion symbols that can be used in Exit-command (-run-at-exit)
| Character | Converts to |
|---|---|
| %z | String value true or false, indicating whether any call chains for errors
or leaks were printed (use it to have your exit script act conditionally when
Purify finds something of interest to you) |
| %x | Program's exit status (0 if the program did not call an exit) |
| %e | Number of distinct access errors printed (displayed) |
| %E | Total number of errors printed |
| %l | Number of bytes of memory leaked (lowercase L) |
| %L | Number of bytes of memory potentially leaked (uppercase L) |
Using program exit status
You have already learned how to run your scripts at the end of instrumented program run. Purify also gives you some information through its exit status. By default, Purify does not modify the normal exit status of your program. However, you can choose to have your program exit with a special exit status if Purify finds any access errors or memory leaks. This is a convenient way to flag failing runs in test suites. Use the
-exit-status=yes
option to enable Purify to insert flags that indicate types of runtime errors. If
there are unsuppressed Purify errors, the status code is computed by doing bit-wise OR
of the following values, depending upon the type of memory error present:- 0x40: Memory access errors
- 0x20: Memory leaks
- 0x10: Potential memory leaks
exit(status)
in your code and the
return
statement in main()
function with a call to the
purify_exit(status)
function. (See Resources for the article on Purify
Application Programming Interface functions.) If you are concerned only about the
memory access errors, you can either turn off leak detection at exit by using the
-leaks-at-exit=no
option, or you can suppress
memory leak and potential leak messages. You can also ignore the appropriate bits
of exit status. However, the program summary message in the Purify report always
shows your original exit status before any other Purify result status bits are OR'ed into it.Listing 1 is an example that exploits the
-exit-status
option and uses the exit status to
determine whether any errors were found in the program.Listing 1. Exit status option example
$ cat prog.c
#include <stdio.h>

int main() {
    int i,j;
    i = j+1;  /* UMR: Reading un-initialized variable j */
    return 0;
}

$ purify -exit-status=yes cc -g prog.c -o prog.pure
$ prog.pure
$ echo $?
64
|
The exit value is not 0 (zero), as returned in function
main. It is 64, which is 0x40 in hexadecimal. That is
because Purify detects an Uninitialized Memory Read (UMR) memory access error in
the program. This option can be easily incorporated in a script that checks the
exit status after running the Purify'd executable and takes appropriate
actions upon finding errors, such as filing a defect report with the test program
or noting the result in the Purify log.If you want your instrumented application to exit upon detecting the first error, you can use the
-exit-on-error
option.
When you use that option, the program exits the moment that Purify encounters an
error (errors that are hidden by using the suppress and
kill directives do not count).Mailing Purify results and assisting analysis
Purify has a
-mail-to-user
option that you can
use to automate reporting of daily or weekly Purify results. When you use this
option, Purify will e-mail the error report to the specified addresses of testers
and developers, and they can verify the results when they receive the e-mail. For
example, suppose that you purify your program this way:$ purify -mail-to-user=yourid cc -g prog.c -o prog.pure
|
When you run the
prog.pure executable thereafter, the Purify report will be sent
automatically to yourid email address.Sometimes, while analyzing the errors, it is useful to look at not only the function names but also other details, such as the complete path of the file where it is located or the PC values. You can enable Purify to display such information by using these options:
- -show-pc shows you the full PC value
- -show-pc-offset shows you the pc-offset from the start of the function
- -show-directory shows you the directory listing where the file containing the function exists (requires program build with debugging)
In this section, you will see an example that uses most of the options that you learned about in this article. Listing 2 shows the
GNUMakefile that contains modified build and test
systems (see Downloads to get the source code used in
this article). If the application name is memerrors, a new target is added for
building a Purify'd application named memerrors.pure. Similarly, a new
target is added to run tests with the Purify'd application. Purify runtime options are set before running the test. For the
-log-file option, a unique log file name is
created, using conversion symbols and the date command (the file name includes
program name, process ID, date, and time). The
-run-at-exit option is used to indicate that, after
program exits, the addsummary.sh script should be run,
along with the arguments specified through conversion symbols (namely, the log
file name, whether any error call chain was printed, exit status, count of memory
errors found, size of memory leaks, and potential memory leaks).
Since the -exit-status=yes option
is not used, Purify will not overwrite the exit status and retain the original
exit status of the program. Listing 2. GNUMakefile with modified build and test systems
# Name of Logfile using Purify conversion symbols and date command
DATEANDTIME     := `date +%Y_%b_%d_%H_%M_%S`
LOGFILENAME     := %v_pid%p_$(DATEANDTIME).plog

# Script to run when Purify'ed program exits
PURIFYEXITSCRIPT:= \"addsummary.sh $(DATEANDTIME) $(LOGFILENAME) %z %x %e %l %L\"

# Purify Options
PURIFYOPTIONS   := -log-file=$(LOGFILENAME) -run-at-exit=$(PURIFYEXITSCRIPT)

# Targets and Rules
all: runtest runpurifytest

# Clean
clean:
 $(RM) memerrors memerrors.pure

# Build Application
memerrors: memerrors.c
 $(CC) -o $@ $?

# Build Purify'ed application
memerrors.pure: memerrors.c
 purify $(CC) -g -o $@ $?

# Run Test Suite
runtest: memerrors
 ./memerrors

# Run Test Suite with Purify'ed application
runpurifytest: memerrors.pure
 echo Starting test at $(DATEANDTIME) .....
 env PURIFYOPTIONS="$(PURIFYOPTIONS)" ./memerrors.pure

# End of GNUMakefile
|
The
addsummary.sh script shown in Listing 3 creates an
HTML report. It maintains a list file that has one HTML table row for each Purify
run so far, in reverse chronological order. When the script is executed upon
exiting Purify, it creates a new list file that contains an HTML table row for the
latest run, appends the file with previous rows, and replaces the old list file
with the new list file. Then it generates an HTML file by an wrapping HTML header
and footer around the list file.Listing 3.Content of the addsummary.sh shell script
#!/bin/sh

DATEANDTIME=$1
LOGFILENAME=$2
LOGFULLNAME=`pwd`/$LOGFILENAME
ERRORFOUND=$3
EXITSTATUS=$4
ERRORCOUNT=$5
LEAKSIZE=$6
PLEAKSIZE=$7

PURIFYREPORT="purify_reports"
REPORTLIST="$PURIFYREPORT.list"
REPORTNEWLIST="$REPORTLIST.new"
REPORTHTML="$PURIFYREPORT.html"

# Start
echo Processing $LOGFILENAME created at $DATEANDTIME

# Create report list file if it does not exist
touch $REPORTLIST

# Create a row for the latest Purify run
echo "<tr>" >> $REPORTNEWLIST
echo "<td>$DATEANDTIME</td>" >> $REPORTNEWLIST
if ($ERRORFOUND == "true"); then
    echo "<td>FAILED</td>" >> $REPORTNEWLIST
else
    echo "<td>Pass</td>" >> $REPORTNEWLIST
fi
echo "<td>$EXITSTATUS</td>" >> $REPORTNEWLIST
echo "<td>$ERRORCOUNT</td>" >> $REPORTNEWLIST
echo "<td>$LEAKSIZE bytes</td>" >> $REPORTNEWLIST
echo "<td>$PLEAKSIZE bytes</td>" >> $REPORTNEWLIST
echo "<td><a href=\"$LOGFULLNAME\">$LOGFILENAME</a></td>" >> $REPORTNEWLIST
echo "</tr>\n" >> $REPORTNEWLIST

# Add this row at the beginning of the table
cat $REPORTLIST >> $REPORTNEWLIST
mv $REPORTNEWLIST $REPORTLIST

# Create HTML page
# Header
echo "<html>"  > $REPORTHTML
echo "<body>" >> $REPORTHTML
echo "<table border=1>" >> $REPORTHTML
echo "<caption>Purify Test Summary</caption>" >> $REPORTHTML
echo "<tr>" >> $REPORTHTML
echo "<th>Date & Time</th><th>Result</th><th>Exit Status</th>"  >> $REPORTHTML
echo "<th>Errors</th><th>Leaks</th><th>Potential Leaks</th>" >> $REPORTHTML
echo "<th>Log File</th>"  >> $REPORTHTML
echo "</tr>\n" >> $REPORTHTML
# Add rows for Purify results
cat $REPORTLIST >> $REPORTHTML
# Footer
echo "</table>" >> $REPORTHTML
echo "</body>" >> $REPORTHTML
echo "</html>" >> $REPORTHTML

# Done
echo "Successfully updated $REPORTHTML"

# End of addsummary.sh
|
Figure 2 shows the HTML page generated after three runs of the test suite. Each run is represented by a row, and each row has a hyperlink to the Purify log file. Each successive run of the test suite will add a new row at the beginning of the table.
Figure 2. Purify Test Summary report in the browser
Summary
As this article explains, you get maximum benefits when you use Purify regularly and systematically. You now know how to incorporate Purify into your software development and testing process and to automate its use with the help of conversions symbols and options.
Although the example used in this article is simple, it demonstrates how easy it is to integrate Purify into your build and test environment and the value of automating Purify usage. Think about the simplicity of checking the Purify test results summary on a Web page that gets updated automatically every time your test suite is executed. All existing log files are also accessible through the same Web page. The example here is intentionally simple, just to show you the possibilities. You can create a quite sophisticated system that compares results and sends e-mail notifications with precise details upon finding any additional memory errors and leaks. You can fix them as soon as they are introduced. With this knowledge, you are ready to reap the maximum benefits of Rational Purify.
2012년 1월 8일 일요일
Purify - 메모리 에러 설명
출처 : http://www.ibm.com/developerworks/rational/library/06/0822_satish-giridhar/
Introduction
Most programmers agree that defects related to incorrect memory usage and management are the hardest to isolate, analyze, and fix. Therefore, they are the costliest defects to have in your programs. These defects are typically caused by using uninitialized memory, using un-owned memory, buffer overruns, or faulty heap management.
IBM® Rational® Purify® is an advanced memory usage error detecting tool that enables software developers and testers to detect memory errors in C and C++ programs. While a program runs, Purify collects and analyzes data to accurately identify memory errors that are about to happen. It provides detailed information, such as the error location (function call stack) and size of the affected memory, to assist you in quickly locating the problem areas. It also greatly reduces debugging time and complexity, so you can focus on fixing the flaw in the application logic that is causing the error.
Purify is available for all prominent platforms, including IBM® AIX® on Power PC®, HP-UX® on PA-RISC, Linux™ on x86 and x86/64, Sun™ Solaris™ on SPARC®, and the Microsoft® Windows® on x86 (check documentation for updated list of supported platform). In this article, you will first learn about various types of memory access errors with the help of examples, and then learn how to use Purify for detecting and fixing those errors. In the Download section, you will find the C source file (memerrors.c) with the code samples in this article, and you can use them to experiment with Purify.
Memory errors
Memory errors can be broadly classified into four categories:
Using memory that you have not initialized
When you read from memory that you forgot to initialize, you get garbage value. This error looks deceptively innocent, but it has the potential to cause mysterious program behavior.
The garbage value that you get could fortuitously happen to be a meaningful value that your program can handle. For example, some operating systems initialize a memory block with zeros when it is allocated for the first time. If zero is a meaningful value for your program, it may run smoothly, initially. However, after the program runs for a while, the memory might be freed and reallocated. When a memory block is recycled, it has the values that were stored in it when it was last used. These values are unpredictable. Depending upon the value, your program may crash immediately, may run for a while and crash sometime later, or may run smoothly but produce strange results. Since the value could be different in each run, the behavior of the program can be baffling, making it hard to reproduce the problem consistently.
Purify detects such errors and reports an Uninitialized Memory Read (UMR) error for every use of uninitialized memory. It further differentiates between using uninitialized memory and copying value from an uninitialized memory location to another memory location. When an uninitialized memory is copied, Purify reports an Uninitialized Memory Copy (UMC) error. After the copying, the destination location also has uninitialized memory; therefore, whenever this memory is used, Purify reports a UMR.
Listing 1 shows a simple example. There are two integers:
Listing 1. An example of UMR and UMC errors
This example is intentionally trivial to make it easy for you to identify the problem just by inspecting the code. But real-world applications have many thousands lines of code and have complex control flow. The location where a valid value is corrupted by copying a garbage value into it, could be in a different function, and potentially in a different sub-system or library. If you inspect the
Listing 2. Another example of UMR and UMC errors
As you notice, whenever a memory location with a UMC error is finally used, Purify reports a UMR error for that same memory location. UMC errors may not always be critical, and Purify hides them by default. Later in this article, you will learn how to see UMC and other errors that Purify hides.
Using memory that you don't own
Explicit memory management and pointer arithmetic present opportunities for designing compact and efficient programs. However, incorrect use of these features can lead to complex defects, such as a pointer referring to memory that you don't own. In this case, too, reading memory through such pointers may give garbage value or cause segmentation faults and core dumps, and using garbage values can cause unpredictable program behavior or crashes.
Purify detects these errors. In addition to reporting the type of error, Purify indicates the memory area that the pointer refers to and where that memory has been allocated. This is typically a good clue for identifying the cause of the error. This category includes following types of errors:
If a pointer's value can potentially be null (NULL), the pointer should not be de-referenced without checking it for being null. For example, a call to
It is common to forget these checks. Purify detects any memory access through de-referencing a null pointer, and reports an NPR or NPW error. When you see this error, examine whether you need to add a null pointer check or whether you wrongly assumed that your program logic guaranteed a non-null pointer. On AIX, HP, and under some linker options in Solaris, dereferencing a null pointer produces a zero value, not a segmentation fault signal.
The memory is divided into pages, and it is "illegal" to read from or write to a memory location on the zero'th page. This error is typically due to null pointer or incorrect pointer arithmetic computations. For example, if you have a null pointer to a structure and you attempt to access various fields of that structure, it will lead to a zero page read error, or ZPR.
Listing 3 shows a simple example of both NPR and ZPR problems. The
Listing 3. An example of NPR and ZPR errors
Invalid Pointer Read or Write (IPR, IPW):
Purify tracks all memory operations. When it detects a pointer to a memory location that has not been allocated to the program, it reports either an IPR or IPW error, depending on whether it was a read or write operation. The error can happen for multiple reasons. For example, you will get this type of error if you have an uninitialized pointer variable and the garbage value happens to be invalid. As another example, if you wanted to do
Listing 4. An example of IPR and IPW errors
IPR and IPW are encountered commonly while using functions that return a pointer (e.g.
Listing 5. Another example of IPR and IPW errors
Free Memory Read or Write (FMR, FMW):
When you use
However, you may have more than one pointer in your program pointing to the same memory location. For instance, while traversing a linked list, you may have a pointer to a node, but a pointer to that node is also stored as
The heap management system may respond to another
Listing 6. An example of FMR and FMW errors
Beyond Stack Read or Write (BSR, BSW) :
If the address of a local variable in a function is directly or indirectly stored in a global variable, in a heap memory location, or somewhere in the stack frame of an ancestor function in the call chain, upon returning from the function, it becomes a stack dangling pointer. When a stack dangling pointer is de-referenced to read from or write to the memory location, it accesses memory outside of the current stack boundaries, and Purify reports a BSR or BSW error. Uninitialized pointer variables or incorrect pointer arithmetic can also result in BSR or BSW errors.
In the example in Listing 7, the
Listing 7. An example of BSR and BSW errors
Using memory that you haven't allocated, or buffer overruns
When you don't do a boundary check correctly on an array, and then you go beyond the array boundary while in a loop, that is called buffer overrun. Buffer overruns are a very common programming error resulting from using more memory than you have allocated. Purify can detect buffer overruns in arrays residing in heap memory, and it reports them as array bound read (ABR) or array bound write (ABW) errors. (See Listing 8.)
Listing 8. An example of ABR and ABW errors
Using faulty heap memory management
Explicit memory management in C and C++ programming puts the onus of managing memory on the programmers. Therefore, you must be vigilant while allocating and freeing heap memory. These are the common memory management mistakes:
When all pointers to a heap memory block are lost, that is commonly called a memory leak. With no valid pointer to that memory, there is no way you can use or release that memory. You lose a pointer to a memory when you overwrite it with another address, or when a pointer variable goes out of the scope, or when you free a structure or an array that has pointers stored in it. Purify scans all of the memory and reports all memory blocks without any pointers pointing to them as memory leaks (MLK). In addition, it reports all blocks as potential leaks, or PLK (called MPK on Windows platforms) when there are no pointers to the beginning of the block but there are pointers to the middle of the block.
Linsting 9 shows a simple example of a memory leak and a heap dangling pointer. In this example, interestingly, methods
First, in the method
Later, the method
Listing 9. An example of a memory leak and a dangling pointer
Listing 10 shows an example of a potential memory leak. After incrementing pointer
Listing 10. An example of potential memory leak
Freeing invalid memory:
This error occurs whenever you attempt to free memory that you are not allowed to free. This may happen for various reasons: allocating and freeing memory through inconsistent mechanisms, freeing a non-heap memory (say, freeing a pointer that points to stack memory), or freeing memory that you haven't allocated. When using Purify for the Windows platform, all such errors are reported as freeing invalid memory (FIM). On the UNIX® system, Purify further classifies these errors by reporting freeing mismatched memory (FMM), freeing non-heap memory (FNH), and freeing unallocated memory (FUM) to indicate the exact reason for the error.
Freeing mismatched memory (FMM) is reported when a memory location is de-allocated by using a function from a different family than the one used for allocation. For example, you use
Listing 11. An example of a freeing mismatched memory error
Freeing non-heap memory (FNH) error is reported when you call
Listing 12. Examples of freeing non-heap memory and freeing unallocated memory errors
Introduction
Most programmers agree that defects related to incorrect memory usage and management are the hardest to isolate, analyze, and fix. Therefore, they are the costliest defects to have in your programs. These defects are typically caused by using uninitialized memory, using un-owned memory, buffer overruns, or faulty heap management.
IBM® Rational® Purify® is an advanced memory usage error detecting tool that enables software developers and testers to detect memory errors in C and C++ programs. While a program runs, Purify collects and analyzes data to accurately identify memory errors that are about to happen. It provides detailed information, such as the error location (function call stack) and size of the affected memory, to assist you in quickly locating the problem areas. It also greatly reduces debugging time and complexity, so you can focus on fixing the flaw in the application logic that is causing the error.
Purify is available for all prominent platforms, including IBM® AIX® on Power PC®, HP-UX® on PA-RISC, Linux™ on x86 and x86/64, Sun™ Solaris™ on SPARC®, and the Microsoft® Windows® on x86 (check documentation for updated list of supported platform). In this article, you will first learn about various types of memory access errors with the help of examples, and then learn how to use Purify for detecting and fixing those errors. In the Download section, you will find the C source file (memerrors.c) with the code samples in this article, and you can use them to experiment with Purify.
Memory errors
Memory errors can be broadly classified into four categories:
- Using memory that you have not initialized
- Using memory that you do not own
- Using more memory than you have allocated (buffer overruns)
- Using faulty heap memory management
Using memory that you have not initialized
When you read from memory that you forgot to initialize, you get garbage value. This error looks deceptively innocent, but it has the potential to cause mysterious program behavior.
The garbage value that you get could fortuitously happen to be a meaningful value that your program can handle. For example, some operating systems initialize a memory block with zeros when it is allocated for the first time. If zero is a meaningful value for your program, it may run smoothly, initially. However, after the program runs for a while, the memory might be freed and reallocated. When a memory block is recycled, it has the values that were stored in it when it was last used. These values are unpredictable. Depending upon the value, your program may crash immediately, may run for a while and crash sometime later, or may run smoothly but produce strange results. Since the value could be different in each run, the behavior of the program can be baffling, making it hard to reproduce the problem consistently.
Purify detects such errors and reports an Uninitialized Memory Read (UMR) error for every use of uninitialized memory. It further differentiates between using uninitialized memory and copying value from an uninitialized memory location to another memory location. When an uninitialized memory is copied, Purify reports an Uninitialized Memory Copy (UMC) error. After the copying, the destination location also has uninitialized memory; therefore, whenever this memory is used, Purify reports a UMR.
Listing 1 shows a simple example. There are two integers:
i and
j. The integer i is initialized with 10. Then the value of j is copied into i. Since j has not been initialized, i also has garbage value after j is copied into it. Purify maintains status of each memory location. It is capable of the analysis that reveals that, although i has been initialized with 10, copying an uninitialized value has made i also uninitialized. Therefore, Purify reports any usage of i (for example, as an argument to printf in the next line) as a UMR error.
Listing 1. An example of UMR and UMC errors
void uninit_memory_errors() {
    int i=10, j;
    i = j;     /* UMC: j is uninitialized, copied into i */
    printf("i = %d\n", i); /* UMR: Using i, which has junk value */
}
This example is intentionally trivial to make it easy for you to identify the problem just by inspecting the code. But real-world applications have many thousands lines of code and have complex control flow. The location where a valid value is corrupted by copying a garbage value into it, could be in a different function, and potentially in a different sub-system or library. If you inspect the
bar method in Listing 2, and you do not know much about foo method, you would not suspect that i would be corrupted after calling the foo
method. Depending upon the size and complexity of the source code, you
may have to spend considerable time and effort to analyze and then to
rectify this type of defect. Purify eliminates this effort and reports
UMRs, indicating the use of uninitialized memory value.Listing 2. Another example of UMR and UMC errors
void foo(int *pi) {
    int j;
    *pi = j; /* UMC: j is uninitialized, copied into *pi */
}

void bar() {
    int i=10;
    foo(&i);
    printf("i = %d\n", i); /* UMR: Using i, which is now junk value */
}
As you notice, whenever a memory location with a UMC error is finally used, Purify reports a UMR error for that same memory location. UMC errors may not always be critical, and Purify hides them by default. Later in this article, you will learn how to see UMC and other errors that Purify hides.
Using memory that you don't own
Explicit memory management and pointer arithmetic present opportunities for designing compact and efficient programs. However, incorrect use of these features can lead to complex defects, such as a pointer referring to memory that you don't own. In this case, too, reading memory through such pointers may give garbage value or cause segmentation faults and core dumps, and using garbage values can cause unpredictable program behavior or crashes.
Purify detects these errors. In addition to reporting the type of error, Purify indicates the memory area that the pointer refers to and where that memory has been allocated. This is typically a good clue for identifying the cause of the error. This category includes following types of errors:
- Null pointer read or write (NPR, NPW)
- Zero page read or write (ZPR, ZPW)
- Invalid pointer read or write (IPR, IPW)
- Free memory read or write (FMR, FMW)
- Beyond stack read or write (BSR, BSW)
If a pointer's value can potentially be null (NULL), the pointer should not be de-referenced without checking it for being null. For example, a call to
malloc can return a null result if no memory is available. Before using the pointer returned by malloc,
you need to check it to make sure that isn't null. For example, a
linked list or tree traversal algorithm needs to check whether the next
node or child node is null. It is common to forget these checks. Purify detects any memory access through de-referencing a null pointer, and reports an NPR or NPW error. When you see this error, examine whether you need to add a null pointer check or whether you wrongly assumed that your program logic guaranteed a non-null pointer. On AIX, HP, and under some linker options in Solaris, dereferencing a null pointer produces a zero value, not a segmentation fault signal.
The memory is divided into pages, and it is "illegal" to read from or write to a memory location on the zero'th page. This error is typically due to null pointer or incorrect pointer arithmetic computations. For example, if you have a null pointer to a structure and you attempt to access various fields of that structure, it will lead to a zero page read error, or ZPR.
Listing 3 shows a simple example of both NPR and ZPR problems. The
findLastNodeValue method has a defect, in that it does not check whether the head parameter is null. NPR and ZPR errors occur when the next and val
fields are accessed, respectively.Listing 3. An example of NPR and ZPR errors
typedef struct node {
    struct node* next;
    int          val;
} Node;

int findLastNodeValue(Node* head) {
    while (head->next != NULL) { /* Expect NPR */
        head = head->next;
    }
    return head->val; /* Expect ZPR */
}

void genNPRandZPR() {
    int i = findLastNodeValue(NULL);
}
Invalid Pointer Read or Write (IPR, IPW):
Purify tracks all memory operations. When it detects a pointer to a memory location that has not been allocated to the program, it reports either an IPR or IPW error, depending on whether it was a read or write operation. The error can happen for multiple reasons. For example, you will get this type of error if you have an uninitialized pointer variable and the garbage value happens to be invalid. As another example, if you wanted to do
*pi = i;, where pi
is a pointer to an integer and i is an integer. But, by mistake, you didn't type the * and wrote just pi = i;. With the help of implicit casting, an integer value is copied as a pointer value. When you dereference pi
again, you may get an IPR or IPW error. This can also happen when
pointer arithmetic results in an invalid address, even when it is not on
the zero'th page. (See Listing 4.)
Listing 4. An example of IPR and IPW errors
void genIPR() {
    int *ipr = (int *) malloc(4 * sizeof(int));
    int i, j;
    i = *(ipr - 1000); j = *(ipr + 1000); /* Expect IPR */
    free(ipr);
}

void genIPW() {
    int *ipw = (int *) malloc(5 * sizeof(int));
    *(ipw - 1000) = 0; *(ipw + 1000) = 0; /* Expect IPW */
    free(ipw);
}
IPR and IPW are encountered commonly while using functions that return a pointer (e.g.
malloc)
in 64-bit applications because pointer is 8 byte long and integer is 4
byte long. If the method declaration is not included, compiler assumes
that the method returns an integer, and implicitly casts the return
value and retains only lower 4 bytes of the pointer value. Purify
reports IPR and IPW upon using this invalid pointer. (See Listing 5.)Listing 5. Another example of IPR and IPW errors
/*Forgot to include following in a 64-bit application:
#include <malloc.h>
#include <stdlib.h>
 */

void illegalPointer() {
    int *pi = (int*) malloc(4 * sizeof(int));
    pi[0] = 10; /* Expect IPW */
    printf("Array value = %d\n", pi[0]); /* Expect IPR */
}
Free Memory Read or Write (FMR, FMW):
When you use
malloc or new, the operating
system allocates memory from heap and returns a pointer to the location
of that memory. When you don't need this memory anymore, you de-allocate
it by calling free or delete. Ideally, after de-allocation, the memory at that location should not be accessed thereafter. However, you may have more than one pointer in your program pointing to the same memory location. For instance, while traversing a linked list, you may have a pointer to a node, but a pointer to that node is also stored as
next in the previous node. Therefore, you
have two pointers to the same memory block. Upon freeing that node,
these pointers will become heap dangling pointers, because they point to memory that has already been freed. Another common cause for
this error is usage of realloc method. (See Listing 6 code.)The heap management system may respond to another
malloc
call in the same program and allocate this freed memory to other,
unrelated objects. If you use a dangling pointer and access the memory
through it, the behavior of the program is undefined. It may result in
strange behavior or crash. The value read from that location would be
completely unrelated and garbage. If you modify memory through a
dangling pointer, and later that value is used for the intended purpose
and unrelated context, the behavior will be unpredictable. Of course,
either an uninitialized pointer or incorrect pointer arithmetic can also
result in pointing to already freed heap memory.Listing 6. An example of FMR and FMW errors
int* init_array(int *ptr, int new_size) {
    ptr = (int*) realloc(ptr, new_size*sizeof(int));
    memset(ptr, 0, new_size*sizeof(int));
    return ptr;
}

int* fill_fibonacci(int *fib, int size) {
    int i;
    /* oops, forgot: fib = */ init_array(fib, size);
    /* fib[0] = 0; */ fib[1] = 1;
    for (i=2; i<size; i++)
        fib[i] = fib[i-1] + fib[i-2];
    return fib;
}

void genFMRandFMW() {
    int *array = (int*)malloc(10);
    fill_fibonacci(array, 3);
}
Beyond Stack Read or Write (BSR, BSW) :
If the address of a local variable in a function is directly or indirectly stored in a global variable, in a heap memory location, or somewhere in the stack frame of an ancestor function in the call chain, upon returning from the function, it becomes a stack dangling pointer. When a stack dangling pointer is de-referenced to read from or write to the memory location, it accesses memory outside of the current stack boundaries, and Purify reports a BSR or BSW error. Uninitialized pointer variables or incorrect pointer arithmetic can also result in BSR or BSW errors.
In the example in Listing 7, the
append
method returns the address
of a local variable. Upon returning from that method, the stack frame
for the method is freed, and stack boundry shrinks. Now the
returned pointer would be outside the stack bounds. If you use that
pointer, Purify will report a BSR or BSW error. In the example,
you would expect append("IBM ", append("Rational ", "Purify")) to return "IBM Rational Purify", but it returns garbage manifesting BSR and BSW errors.Listing 7. An example of BSR and BSW errors
char *append(const char* s1, const char *s2) {
    const int MAXSIZE = 128;
    char result[128];
    int i=0, j=0;

    for (j=0; i<MAXSIZE-1 && j<strlen(s1); i++,j++) {
        result[i] = s1[j];
    }

    for (j=0; i<MAXSIZE-1 && j<strlen(s2); i++,j++) {
        result[i] = s2[j];
    }

    result[++i] = '\0';
    return result;
}

void genBSRandBSW() {
    char *name = append("IBM ", append("Rational ", "Purify"));
    printf("%s\n", name); /* Expect BSR */
    *name = '\0'; /* Expect BSW */
}
Using memory that you haven't allocated, or buffer overruns
When you don't do a boundary check correctly on an array, and then you go beyond the array boundary while in a loop, that is called buffer overrun. Buffer overruns are a very common programming error resulting from using more memory than you have allocated. Purify can detect buffer overruns in arrays residing in heap memory, and it reports them as array bound read (ABR) or array bound write (ABW) errors. (See Listing 8.)
Listing 8. An example of ABR and ABW errors
void genABRandABW() {
    const char *name = "IBM Rational Purify";
    char *str = (char*) malloc(10);
    strncpy(str, name, 10);
    str[11] = '\0'; /* Expect ABW */
    printf("%s\n", str); /* Expect ABR */
}
Using faulty heap memory management
Explicit memory management in C and C++ programming puts the onus of managing memory on the programmers. Therefore, you must be vigilant while allocating and freeing heap memory. These are the common memory management mistakes:
- Memory leaks and potential memory leaks (MLK, PLK, MPK)
- Freeing invalid memory (FIM)
- Freeing mismatched memory (FMM)
- Freeing non-heap memory (FNH)
- Freeing unallocated memory (FUM)
When all pointers to a heap memory block are lost, that is commonly called a memory leak. With no valid pointer to that memory, there is no way you can use or release that memory. You lose a pointer to a memory when you overwrite it with another address, or when a pointer variable goes out of the scope, or when you free a structure or an array that has pointers stored in it. Purify scans all of the memory and reports all memory blocks without any pointers pointing to them as memory leaks (MLK). In addition, it reports all blocks as potential leaks, or PLK (called MPK on Windows platforms) when there are no pointers to the beginning of the block but there are pointers to the middle of the block.
Linsting 9 shows a simple example of a memory leak and a heap dangling pointer. In this example, interestingly, methods
foo and main
independently seem to be error-free, but together they manifest both
errors. This example demonstrates that interactions between methods may
expose
multiple flaws that you may not find simply by inspecting individual
functions. Real-world applications are very complex, thus tedious and
time-consuming for you to inspect and to analyze the control flow and
its consequences. Using Purify gives you vital help in detecting errors
in such situations.First, in the method
foo, the pointer pi is
overwritten with a new memory allocation, and all pointers to the old
memory block are lost. This results in leaking the memory block that was
allocated in method main. Purify reports a memory leak
(MLK) and specifies the line where the leaked memory was allocated. It
eliminates the slow process of hunting down the memory block that is
leaking, therefore shortens the debugging time. You can start debugging
at the memory allocation site where the leak is reported, and then track
what you are doing with that pointer and where you are overwriting it.Later, the method
foo frees up the memory it has allocated, but the pointer pi still holds the address (it is not set to null). After returning from method foo to main, when you use the pointer pi, it refers to the memory that has already been freed, so pi becomes a dangling pointer. Purify promptly reports a FMW error at that location.Listing 9. An example of a memory leak and a dangling pointer
int *pi;
void foo() {
    pi = (int*) malloc(8*sizeof(int)); /* Allocate memory for pi */
    /* Oops, leaked the old memory pointed by pi holding 4 ints */
    /* use pi */
    free(pi); /* foo() is done with pi, so free it */
}
void main() {
    pi = (int*) malloc(4*sizeof(int)); /* Expect MLK: foo leaks it */
    foo();
    pi[0] = 10; /* Expect FMW: oops, pi is now a dangling pointer */
}
Listing 10 shows an example of a potential memory leak. After incrementing pointer
plk,
it points to the middle of the memory block, but there is no pointer
pointing to the beginning of that memory block. Therefore, a potential
memory leak is reported at the memory allocation site for that block.Listing 10. An example of potential memory leak
int *plk = NULL;
void genPLK() {
    plk = (int *) malloc(2 * sizeof(int)); /* Expect PLK */
    plk++;
}
Freeing invalid memory:
This error occurs whenever you attempt to free memory that you are not allowed to free. This may happen for various reasons: allocating and freeing memory through inconsistent mechanisms, freeing a non-heap memory (say, freeing a pointer that points to stack memory), or freeing memory that you haven't allocated. When using Purify for the Windows platform, all such errors are reported as freeing invalid memory (FIM). On the UNIX® system, Purify further classifies these errors by reporting freeing mismatched memory (FMM), freeing non-heap memory (FNH), and freeing unallocated memory (FUM) to indicate the exact reason for the error.
Freeing mismatched memory (FMM) is reported when a memory location is de-allocated by using a function from a different family than the one used for allocation. For example, you use
new operator to allocate memory, but use method free to de-allocate it. Purify checks for the following families, or matching pairs:malloc()/free()calloc()/free()realloc()/free()- operator
new/ operatordelete - operator
new[]/ operatordelete[]
malloc method but freed using the delete
operator, which is not the correct counterpart, thus incompatible.
Another common example of an FMM error is C++ programs that allocate an
array using the new[] operator, but free the memory using a scalar delete operator instead of array delete[]
operator. These errors are hard to detect through code inspection,
because the memory allocation and de-allocation locations may not be
located close to each other, and because there is no difference in
syntax between an integer pointer and a pointer to an integer array.Listing 11. An example of a freeing mismatched memory error
void genFMM() {
    int *pi = (int*) malloc(4 * sizeof(int));
    delete pi; /* Expect FMM/FIM: should have used free(pi); */
    pi = new int[5];
    delete pi; /* Expect FMM/FIM: should have used delete[] pi; */
}
Freeing non-heap memory (FNH) error is reported when you call
free with a non-heap address (a stack address, for instance). Freeing unallocated memory (FUM)
is reported when you try to free unallocated memory, such as memory
that you have already freed, or the pointer you are trying to free
points to the middle of a memory block. Listing 12 shows examples of these errors.Listing 12. Examples of freeing non-heap memory and freeing unallocated memory errors
void genFNH() {
    int fnh = 0;
    free(&fnh); /* Expect FNH: freeing stack memory */
}

void genFUM() {
    int *fum = (int *) malloc(4 * sizeof(int));
    free(fum+1); /* Expect FUM: fum+1 points to middle of a block */
    free(fum);
    free(fum); /* Expect FUM: freeing already freed memory */
}
Purify - 고급 사용법
출처 : http://www.ibm.com/developerworks/rational/library/08/0226_gupta-gaurav/index.html
본 자료는 Purify 옵션과 지시문에 대한 개요를 먼저 소개하고 다음 항목에 대한 설명을 하고자 합니다:
Purify에서는 아래의 두가지 옵션을 통해 세밀한 제어를 제공합니다.
$ purify -static-checking=no cc your_prog.c
런타임 옵션은 삽입된 프로그램의 런타임 행위에 영향을 줍니다. 예를 들어 보고된 에러에 대한 콜 스택 체인을 더 길게 보여주고자 할 때 아래와 같은 옵션을 사용합니다:
$ purify -chain-length=10 cc your_prog.c
옵션은 링크 라인 뿐아니라 환경변수 PUREOPTIONS 와 PURIFYOPTIONS 를 통해 표현할 수 있습니다.
$ export PURIFYOPTIONS="-static-checking=no -chain-length=10"
csh 또는 tcsh 쉘을 사용하는 경우:
% setenv PURIFYOPTIONS "-static-checking=no -chain-length=10"
링크 라인에 명시된 빌드타임 옵션은 환경변수에 나타난 같은 옵션을 덮어씁니다.
Purify는 삽입시점의 런타임 옵션을 삽입된 프로그램에 저장합니다. 실행시, (-ignore-runtime-environment 빌드타임 옵션을 사용하지 않는 경우) 환경변수는 삽입된 프로그램에 저장된 런타임 옵션을 덮어씁니다.
Purify GUI를 통해 명시한 런타임 옵션은 환경변수 및 링크라인에 명시된 옵션을 덮어씁니다.
Purify는 도움말 및 버전 문자열을 제공하기 위해 여러 빌드타임 옵션을 제공합니다:
$ purify -version
$ purify -usage
$ purify -help
$ purify -onlinehelp
-print-home-dir 빌드타임 옵션은 Purify가 설치된 디렉토리를 출력합니다. 이를 이용하여, 아래처럼 purify_what_options 스크립트를 실행하여 삽입시 사용된 옵션을 알아볼 수 있습니다:
$ `purify -print-home-dir`/purify_what_options <your_prog.pure>
Purify API를 사용하기 위해 purify.h를 프로그램에 포함시키는 경우, 컴파일러의 헤더파일 탐색경로를 아래처럼 표기할 수 있습니다:
$ cc -c -I`purify -print-home-dir` your_prog.c
Purify 지시문
커맨드 라인 옵션외에 추가로 다양한 지시문을 명시함으로써 삽입 및 에러 보고에 대한 상세 제어를 할 수 있습니다.
예를 들어 써드파티 라이브러리(libfoo)에 있는 함수(foo)에 메모리에러(uninitialized memory read, UMR)가 있다고 가정해 봅니다. 라이브러리 제공 벤더에 에러를 보고했고, 이에 대한 픽스를 기다리는 동안에, Purify 분석 결과에서 해당 에러를 보이지 않게 하고 싶다면, suppress 지시문을 아래와 같이 사용합니다:
suppress umr foo
만약 suppress 지시문을 통해 보이지않는 에러를 보고싶다면 Purify GUI의 View 메뉴에서 Suppressed를 클릭합니다.
Purify는 아래 예처럼 구체적으로 또는 일반적으로 기술할 수 있도록 합니다:
또 다른 방법으로 Purify GUI에서 에러를 선택하고 팝업메뉴에서 Suppress를 선택할 수 있습니다. 그리고 그림 1에서 처럼, 에러타입, 콜체인타입 등을 명시할 수 있습니다. .purify 파일 위치를 지정한 후 Make permanent를 클릭하여 저장할 수도 있습니다.
그림 1. Purify Suppression 대화상자

또다른 지시문 kill은 suppress와 거의 유사하지만, GUI에서 View > Suppressed Messages 메뉴를 사용해도 볼 수 없습니다. 어떤 에러가 아주 많이 발생하는 경우에 suppress 대신 kill을 사용하면 프로그램 실행이 더 빨라집니다.
캐시 관리
프로그램에 대한 삽입시에, Purify는 프로그램에서 직접 또는 간접적으로(예 libc) 사용하는 모든 라이브러리들 또한 삽입을 하고 삽입된 라이브러리를 원 라이브러리 대신 프로그램과 바인딩을 합니다. 만약 라이브러리가 있는 디렉토리에 쓰기권한이 있다면 해당 라이브러리 디렉토리에 삽입된 라이브러리를 생성합니다.
만약 쓰기 권한이 없다면, Purify 설치 영역내 디폴트 캐시 디렉토리에 삽입된 라이브러리를 생성합니다.
이러한 캐시관련된 여러 빌드타임 옵션이 있습니다. 삽입된 라이브러리를 여러 디렉토리에 산재하지 않고 캐시 디렉토리에 저장하기를 원한다면 -always-use-cache-dir 옵션을 사용합니다. 디폴트 캐시 디렉토리 대신 별도 캐시 디렉토리를 지정하길 원한다면 -cache-dir=<dir-name> 옵션을 사용합니다. 이러한 옵션들을 통해서, 손쉽게 캐시 디렉토리를 삭제함으로써 모든 삽입된 라이브러리를 제거할 수 있습니다.
프로그램에 대한 삽입시에, Purify는 마지막 삽입이후 변경이 있거나 삽입된 라이브러리를 찾을 수 없는 경우에만 라이브러리를 삽입합니다. 이는 삽입 시간을 절약하는 데 도움이 됩니다. 만약 이전에 삽입된 라이브러리를 무시하고 모든 필요한 라이브러리를 삽입하고자 할때는 -force-rebuild 옵션을 사용합니다. 이는 고급 옵션 (예 -static-checking-guardzone)를 사용하여 재 삽입을 강제할 경우 유용합니다.
일반적으론, 하나의 머신에서 삽입한 프로그램은 다른 머신에서 실행할 수 없습니다. 일반적으로 프로그램은 시스템 라이브러리들(예 libc)에 의존하는 데, 시스템 라이브러리들은 OS 패키지들의 다양한 패치 수준에 따라서 머신마다 달라질 수 있습니다.
프로그램이 같은 시스템의 원래 라이브러리에 상응하는 삽입된 라이브러리를 사용하도록 보장하기 위해서, Purify는 삽입된 라이브러리를 호스트 이름 별로 캐시하는 메커니즘을 제공합니다.
한편, 프로그램은 모든 머신에서 똑같거나 같은 네트워크 위치로 접근할 수 있는 라이브러리나 써드파티 라이브러리를 사용할 수도 있습니다. 이런 경우, 각각의 호스트별로 삽입된 해당 라이브러리를 가지고 싶어하지 않을 겁니다. 사본이 똑같기에 저장공간을 낭비하기 때문입니다. 이를 위해 Purify는 IBM® AIX®, Linux® 및 Solaris® UNIX® 플랫폼에서 repure 메커니즘을 제공합니다. 다만 삽입시에 다음과 같은 점을 주의해야 합니다:
오래된 삽입된 파일들을 삭제하고 싶다면, Purify 설치 영역의 pure_remove_old_files 스크립트를 실행합니다:
`purify -print-home-dir`/pure_remove_old_files <path> <days>
이 스크립트는 _pure_를 포함한 파일이나 .so 나 .sl 확장자를 갖는 공유 라이브러리 파일등 삽입된 라이브러리들만을 제거합니다. 예를 들어 파일시스템 상의 14일 이상된 모든 삽입된 파일을 삭제할 경우, 아래와 같이 실행합니다:
$ pure_remove_old_files / 14
부분 Purify
Purify는 부당한 메모리 엑세스를 체크하기 위해 관심있는 곳에 삽입을 합니다. 체크를 하고, 체크에 필요한 데이터를 관리하는 것은 성능 상의 오버헤드를 초래합니다. 때때로 프로그램의 특정 콤포넌트들에 있는 메모리 에러에만 관심이 가능 경우도 있습니다. 이러한 경우 부분적으로 프로그램에 삽입을 하고 관심없는 공유 라이브러리를 배제할 수 있는 메커니즘을 통해 삽입된 프로그램 실행시 실행시 오버헤드를 많이 줄일 수 있습니다.
주의:
부분 삽입은 HP-UX와 AIX 플랫폼에서만 동작합니다. Solaris SPARC 플랫폼은 제한적으로 지원하고, Solaris x86 및 Linux 플랫폼은 지원하지 않습니다.
공유 라이브러리를 배제하더라도, Purify는 배제된 공유라이브러리에서 할당받은 메모리 누스 등 힙 관리 에러를 탐지합니다.
부분 삽입을 통해 아래처럼 라이브러리를 배제할 수 있습니다:
$ purify -selective -exclude-libs=libfoo1.so:libfoo2.so cc -g app.c \
-o a.out.pure -lfoo1 -lfoo2 -lbar
-exclude-libs 옵션에 콜론으로 나열한 라이브러리 목록을 제공하거나 .purify 지시문 파일에 exclude 지시문을 사용할 수도 있습니다:
exclude libfoo*
-selective 옵션을 사용하면 Purify가 라이브러리 배제로 인해 발행할 수 있는 에러를 탐지해서 배제할 수 있도록 지시합니다:
Purify는 삽입처리되지 않는 코드에서 발생한 버퍼 오버런 에러를 탐지할 수 있습니다만 에러가 발생한 시점이 아닌 버퍼가 해제되는 시점에 탐지합니다. Purify는 에러가 발생할 때 보고를 하지만 삽입되지 않는 코드에 대한 에러는 제때 보고할 수 없습니다. -late-detect-logic 옵션은 힙 메모리 블럭이 해제될 때 추가적인 체크를 하도록 합니다. 버퍼 오버런을 탐지한 경우, Array Bound Write Late (ABWL) 에러를 보고합니다.
힙 메모리 관리 에러
Purify 는 삽입된 프로그램 실행시 메모리 및 실행 시간 오버헤드를 제어할 수 있는 몇가지 옵션을 제공합니다. 프로그램이 메모리블럭을 해제할 때, Purify는 곧바로 해당 메모리를 해제하지 않습니다. 대신에, 해제된 메모리를 FIFO 큐에 넣습니다. 이를 통해 Purify는 해제된 메모리를 가리키는 포인터에 대한 에러(Free Memory Read/Write, FMR/FMW)를 탐지하고 보고할 수 있습니다. 만약 해제된 메모리가 바로 힙으로 반환됐다면 곧바로 재사용될 수 있었지만 Purify는 해제된 블럭에 대한 부당한 엑세스인지 할당된 블럭에 대한 합당한 엑세스인지 알수 없을 겁니다.
큐의 디폴트 크기는 100입니다. 큐가 꽉 차면, Purify는 큐의 첫번째 메모리 블럭을 해제한 뒤 새로 할당받은 블럭을 추가합니다. 큐의 크기는 -free-queue-length=<value> 옵션으로 변경할 수 있습니다. 큐 크기가 커지면 부당한 포인터를 탐지할 가능성을 높이지만, 메모리 오버헤드 비용은 커지게 됩니다..
프리 큐는 작은 블럭에만 사용되며 임계치 이하의 블럭을 관리합니다. 큰 블럭은 바로 해제하여 힙으로 넘겨서 많은 메모리 사용의 위험성을 회피합니다. -free-queue-threshold=<value> 옵션으로 해당 임계치를 명시할 수 있습니다. 디폴트는 10000 바이트입니다. 즉 10000 바이트 이상의 블럭은 곧바로 해제됩니다.
Purify는 프로그램 종료시점에 모든 메모리 누수를 보고합니다. 사용중인 메모리 블럭에 대한 정보가 필요하다면, -inuse-at-exit=yes 옵션을 사용합니다. 마찬가지로 프로그램 종료시에 사용중인 파일 디스크립터에 대한 정보가 필요하면, -fds-inuse-at-exit=yes 옵션을 사용합니다.
AIX 시스템에서는, 메모리 누수에만 관심이 있는 경우, -memory-leaks-only 옵션을 사용할 수 있으며, 이 경우 Purify는 메모리 누수 및 Freeing Memory Mismatch (FMM) 에러 같은 몇몇 힙 관리 에러 탐지를 위한 매우 가벼운 삽입처리를 합니다. 이로 인해 실행시 일상적인 메모리 엑세스 검증을 하지 않아서 실행이 훨씬 빨리집니다.
본 자료는 Purify 옵션과 지시문에 대한 개요를 먼저 소개하고 다음 항목에 대한 설명을 하고자 합니다:
- 캐시 관리: 삽입한 바이너리 파일의 관리 및 공유하는 방법
- 부분 Purify: 프로그램의 일부부만을 삽입하여 실행 시간 오버헤드와 탐지 영역을 줄이는 방법
- 힙 메모리 관리: 프로그램 실행시 메모리 오버헤드를 제한하고 힙 사용 보고서를 맞춤 설정하는 방법
Purify에서는 아래의 두가지 옵션을 통해 세밀한 제어를 제공합니다.
- 빌드타임 옵션
- 런타임 옵션
$ purify -static-checking=no cc your_prog.c
런타임 옵션은 삽입된 프로그램의 런타임 행위에 영향을 줍니다. 예를 들어 보고된 에러에 대한 콜 스택 체인을 더 길게 보여주고자 할 때 아래와 같은 옵션을 사용합니다:
$ purify -chain-length=10 cc your_prog.c
옵션은 링크 라인 뿐아니라 환경변수 PUREOPTIONS 와 PURIFYOPTIONS 를 통해 표현할 수 있습니다.
- 환경변수 PUREOPTIONS는 Purify, Quantify 및 PureCoverage에도 적용됩니다.
- 환경변수 PURIFYOPTIONS는 Purify에만 적용됩니다.
$ export PURIFYOPTIONS="-static-checking=no -chain-length=10"
csh 또는 tcsh 쉘을 사용하는 경우:
% setenv PURIFYOPTIONS "-static-checking=no -chain-length=10"
Purify는 삽입시점의 런타임 옵션을 삽입된 프로그램에 저장합니다. 실행시, (-ignore-runtime-environment 빌드타임 옵션을 사용하지 않는 경우) 환경변수는 삽입된 프로그램에 저장된 런타임 옵션을 덮어씁니다.
Purify GUI를 통해 명시한 런타임 옵션은 환경변수 및 링크라인에 명시된 옵션을 덮어씁니다.
Purify는 도움말 및 버전 문자열을 제공하기 위해 여러 빌드타임 옵션을 제공합니다:
$ purify -version
$ purify -usage
$ purify -help
$ purify -onlinehelp
-print-home-dir 빌드타임 옵션은 Purify가 설치된 디렉토리를 출력합니다. 이를 이용하여, 아래처럼 purify_what_options 스크립트를 실행하여 삽입시 사용된 옵션을 알아볼 수 있습니다:
$ `purify -print-home-dir`/purify_what_options <your_prog.pure>
Purify API를 사용하기 위해 purify.h를 프로그램에 포함시키는 경우, 컴파일러의 헤더파일 탐색경로를 아래처럼 표기할 수 있습니다:
$ cc -c -I`purify -print-home-dir` your_prog.c
Purify 지시문
커맨드 라인 옵션외에 추가로 다양한 지시문을 명시함으로써 삽입 및 에러 보고에 대한 상세 제어를 할 수 있습니다.
예를 들어 써드파티 라이브러리(libfoo)에 있는 함수(foo)에 메모리에러(uninitialized memory read, UMR)가 있다고 가정해 봅니다. 라이브러리 제공 벤더에 에러를 보고했고, 이에 대한 픽스를 기다리는 동안에, Purify 분석 결과에서 해당 에러를 보이지 않게 하고 싶다면, suppress 지시문을 아래와 같이 사용합니다:
suppress umr foo
Purify는 아래 예처럼 구체적으로 또는 일반적으로 기술할 수 있도록 합니다:
- 특정 콜 체인 상의 UMR를 숨기고자 할때는 전체 콜 체인을 제시합니다:
suppress umr printf; foo; bar; main
- 일부 콜 체인과 매칭되는 UMR를 숨기고자 할때는 생략(...) 기호를 통해 제시합니다:
suppress umr ...; foo; ...; main
- 특정 라이브러리의 모든 UMR를 숨기고자 할때는 해당 라이브러리를 제시합니다:
suppress umr "libfoo*"
- 모든 UMR를 숨기고자 할때는 다음과 같습니다 (물론 위험천만한(?) 생각입니다):
suppress umr *
- <purify-installation-home>/.purify
- <users-home-dir>/.purify
- <current-working-directory>/.purify
또 다른 방법으로 Purify GUI에서 에러를 선택하고 팝업메뉴에서 Suppress를 선택할 수 있습니다. 그리고 그림 1에서 처럼, 에러타입, 콜체인타입 등을 명시할 수 있습니다. .purify 파일 위치를 지정한 후 Make permanent를 클릭하여 저장할 수도 있습니다.
그림 1. Purify Suppression 대화상자
또다른 지시문 kill은 suppress와 거의 유사하지만, GUI에서 View > Suppressed Messages 메뉴를 사용해도 볼 수 없습니다. 어떤 에러가 아주 많이 발생하는 경우에 suppress 대신 kill을 사용하면 프로그램 실행이 더 빨라집니다.
캐시 관리
프로그램에 대한 삽입시에, Purify는 프로그램에서 직접 또는 간접적으로(예 libc) 사용하는 모든 라이브러리들 또한 삽입을 하고 삽입된 라이브러리를 원 라이브러리 대신 프로그램과 바인딩을 합니다. 만약 라이브러리가 있는 디렉토리에 쓰기권한이 있다면 해당 라이브러리 디렉토리에 삽입된 라이브러리를 생성합니다.
만약 쓰기 권한이 없다면, Purify 설치 영역내 디폴트 캐시 디렉토리에 삽입된 라이브러리를 생성합니다.
이러한 캐시관련된 여러 빌드타임 옵션이 있습니다. 삽입된 라이브러리를 여러 디렉토리에 산재하지 않고 캐시 디렉토리에 저장하기를 원한다면 -always-use-cache-dir 옵션을 사용합니다. 디폴트 캐시 디렉토리 대신 별도 캐시 디렉토리를 지정하길 원한다면 -cache-dir=<dir-name> 옵션을 사용합니다. 이러한 옵션들을 통해서, 손쉽게 캐시 디렉토리를 삭제함으로써 모든 삽입된 라이브러리를 제거할 수 있습니다.
프로그램에 대한 삽입시에, Purify는 마지막 삽입이후 변경이 있거나 삽입된 라이브러리를 찾을 수 없는 경우에만 라이브러리를 삽입합니다. 이는 삽입 시간을 절약하는 데 도움이 됩니다. 만약 이전에 삽입된 라이브러리를 무시하고 모든 필요한 라이브러리를 삽입하고자 할때는 -force-rebuild 옵션을 사용합니다. 이는 고급 옵션 (예 -static-checking-guardzone)를 사용하여 재 삽입을 강제할 경우 유용합니다.
일반적으론, 하나의 머신에서 삽입한 프로그램은 다른 머신에서 실행할 수 없습니다. 일반적으로 프로그램은 시스템 라이브러리들(예 libc)에 의존하는 데, 시스템 라이브러리들은 OS 패키지들의 다양한 패치 수준에 따라서 머신마다 달라질 수 있습니다.
프로그램이 같은 시스템의 원래 라이브러리에 상응하는 삽입된 라이브러리를 사용하도록 보장하기 위해서, Purify는 삽입된 라이브러리를 호스트 이름 별로 캐시하는 메커니즘을 제공합니다.
한편, 프로그램은 모든 머신에서 똑같거나 같은 네트워크 위치로 접근할 수 있는 라이브러리나 써드파티 라이브러리를 사용할 수도 있습니다. 이런 경우, 각각의 호스트별로 삽입된 해당 라이브러리를 가지고 싶어하지 않을 겁니다. 사본이 똑같기에 저장공간을 낭비하기 때문입니다. 이를 위해 Purify는 IBM® AIX®, Linux® 및 Solaris® UNIX® 플랫폼에서 repure 메커니즘을 제공합니다. 다만 삽입시에 다음과 같은 점을 주의해야 합니다:
- 먼저, 모든 머신상에 존재하는 로컬 경로를 선정합니다.예를 들어 /tmp 디렉토리는 모든 머신에 있지만 로컬 경로이고, 머신 간에 공유되고 있지 않습니다. 팁: 홈 디렉토리나 NFS 상의 디렉토리를 사용하지 마십시요.
- -local-cache-dir 옵션을 사용하여, 시스템에 특화된 라이브러리의 삽입 결과를 저장할 경로를 지정합니다. 예:
$ purify -always-use-cache-dir -local-cache-dir=/tmp -cache-dir=./cache \
cc -g test.c -o test.pure - 같은 머신에서 삽입된 프로그램을 실행할 수 있습니다:
$ ./test.pure
- 다른 머신에서 삽입된 프로그램을 실행하길 원한다면, 다른 머신에서 repure를 실행합니다:
$ repure ./test.pure
- repure 실행 후 다른 머신에서 프로그램을 실행할 수 있습니다:
$ ./test.pure
오래된 삽입된 파일들을 삭제하고 싶다면, Purify 설치 영역의 pure_remove_old_files 스크립트를 실행합니다:
`purify -print-home-dir`/pure_remove_old_files <path> <days>
이 스크립트는 _pure_를 포함한 파일이나 .so 나 .sl 확장자를 갖는 공유 라이브러리 파일등 삽입된 라이브러리들만을 제거합니다. 예를 들어 파일시스템 상의 14일 이상된 모든 삽입된 파일을 삭제할 경우, 아래와 같이 실행합니다:
$ pure_remove_old_files / 14
부분 Purify
Purify는 부당한 메모리 엑세스를 체크하기 위해 관심있는 곳에 삽입을 합니다. 체크를 하고, 체크에 필요한 데이터를 관리하는 것은 성능 상의 오버헤드를 초래합니다. 때때로 프로그램의 특정 콤포넌트들에 있는 메모리 에러에만 관심이 가능 경우도 있습니다. 이러한 경우 부분적으로 프로그램에 삽입을 하고 관심없는 공유 라이브러리를 배제할 수 있는 메커니즘을 통해 삽입된 프로그램 실행시 실행시 오버헤드를 많이 줄일 수 있습니다.
주의:
부분 삽입은 HP-UX와 AIX 플랫폼에서만 동작합니다. Solaris SPARC 플랫폼은 제한적으로 지원하고, Solaris x86 및 Linux 플랫폼은 지원하지 않습니다.
공유 라이브러리를 배제하더라도, Purify는 배제된 공유라이브러리에서 할당받은 메모리 누스 등 힙 관리 에러를 탐지합니다.
부분 삽입을 통해 아래처럼 라이브러리를 배제할 수 있습니다:
$ purify -selective -exclude-libs=libfoo1.so:libfoo2.so cc -g app.c \
-o a.out.pure -lfoo1 -lfoo2 -lbar
-exclude-libs 옵션에 콜론으로 나열한 라이브러리 목록을 제공하거나 .purify 지시문 파일에 exclude 지시문을 사용할 수도 있습니다:
exclude libfoo*
- 예를 들어 main()이 foo()를 호출하고, foo()는 bar()를 호출하는 경우에 foo()를 삽입에서 배제한다고 가정합니다. 추가로 main()에서 메모리를 할당받고, foo()에서 메모리를 초기화 하고, bar()에서 메모리를 사용한다고 가정합니다. foo()를 삽입처리하지 않은 경우, Purify는 foo()에서 메모리가 초기화되었다는 것을 알지 못하므로, bar()에서 메모리를 사용할 때, uninitialized memory read (UMR) 에러를 보고할 수 있습니다. -selective 옵션은 이런 경우 Purify가 이런 류의 에러를 제거하도록 지시합니다.
- 라이브러리를 배제한 경우 Purify가 몇몇 에러를 찾지 못할 수 있습니다. 예를 들어 main()이 foo()를 호출하고 초기화되지 않은 버퍼를 전달한다고 가정합니다. Purify는 foo()에서 버퍼를 사용할 때마다 UMR를 보고합니다. 만약 foo()가 libfoo.so 공유라이브러리에 있고, 이를 배제했다고 한다면, Purify는 관련 메모리 체킹 코드를 삽입하지 못했기 때문에, 삽입된 코드에서 실행이 된다고 하더라도 foo()에서 초기화하지 않은 버퍼를 사용하더라도 탐지를 할 수 없습니다.
Purify는 삽입처리되지 않는 코드에서 발생한 버퍼 오버런 에러를 탐지할 수 있습니다만 에러가 발생한 시점이 아닌 버퍼가 해제되는 시점에 탐지합니다. Purify는 에러가 발생할 때 보고를 하지만 삽입되지 않는 코드에 대한 에러는 제때 보고할 수 없습니다. -late-detect-logic 옵션은 힙 메모리 블럭이 해제될 때 추가적인 체크를 하도록 합니다. 버퍼 오버런을 탐지한 경우, Array Bound Write Late (ABWL) 에러를 보고합니다.
힙 메모리 관리 에러
Purify 는 삽입된 프로그램 실행시 메모리 및 실행 시간 오버헤드를 제어할 수 있는 몇가지 옵션을 제공합니다. 프로그램이 메모리블럭을 해제할 때, Purify는 곧바로 해당 메모리를 해제하지 않습니다. 대신에, 해제된 메모리를 FIFO 큐에 넣습니다. 이를 통해 Purify는 해제된 메모리를 가리키는 포인터에 대한 에러(Free Memory Read/Write, FMR/FMW)를 탐지하고 보고할 수 있습니다. 만약 해제된 메모리가 바로 힙으로 반환됐다면 곧바로 재사용될 수 있었지만 Purify는 해제된 블럭에 대한 부당한 엑세스인지 할당된 블럭에 대한 합당한 엑세스인지 알수 없을 겁니다.
큐의 디폴트 크기는 100입니다. 큐가 꽉 차면, Purify는 큐의 첫번째 메모리 블럭을 해제한 뒤 새로 할당받은 블럭을 추가합니다. 큐의 크기는 -free-queue-length=<value> 옵션으로 변경할 수 있습니다. 큐 크기가 커지면 부당한 포인터를 탐지할 가능성을 높이지만, 메모리 오버헤드 비용은 커지게 됩니다..
프리 큐는 작은 블럭에만 사용되며 임계치 이하의 블럭을 관리합니다. 큰 블럭은 바로 해제하여 힙으로 넘겨서 많은 메모리 사용의 위험성을 회피합니다. -free-queue-threshold=<value> 옵션으로 해당 임계치를 명시할 수 있습니다. 디폴트는 10000 바이트입니다. 즉 10000 바이트 이상의 블럭은 곧바로 해제됩니다.
Purify는 프로그램 종료시점에 모든 메모리 누수를 보고합니다. 사용중인 메모리 블럭에 대한 정보가 필요하다면, -inuse-at-exit=yes 옵션을 사용합니다. 마찬가지로 프로그램 종료시에 사용중인 파일 디스크립터에 대한 정보가 필요하면, -fds-inuse-at-exit=yes 옵션을 사용합니다.
AIX 시스템에서는, 메모리 누수에만 관심이 있는 경우, -memory-leaks-only 옵션을 사용할 수 있으며, 이 경우 Purify는 메모리 누수 및 Freeing Memory Mismatch (FMM) 에러 같은 몇몇 힙 관리 에러 탐지를 위한 매우 가벼운 삽입처리를 합니다. 이로 인해 실행시 일상적인 메모리 엑세스 검증을 하지 않아서 실행이 훨씬 빨리집니다.
2012년 1월 7일 토요일
Purify Linux - 사용법 개요
출처 : http://www.ibm.com/developerworks/rational/library/05/r-3120/index.html
간단한 프로그램 분석을 통해 다음 두가지를 보여주고자 합니다.
(1) 리눅스에 Purify가 제대로 설치되어 있는 지 확인합니다.
(2) 작고 간단한 프로그램이지만 에러가 발생하기가 쉬우며 어떤 수정이 필요한지 보여줍니다.
아래 conv.c는 화씨를 섭씨로 변경하는 C 프로그램으로 Kernighan 및 Ritchie의 The C Programming Language에 예시된 프로그램을 조금 변경한 것입니다.
#include <stdio.h>
#include <stdlib.h>
#include <malloc.h>
main()
{
int *fahr;
fahr = (int *)malloc(sizeof(int));
int celsius;
int lower, upper, step;
celsius = lower + 10;
lower = 0; /* lower limit of temperature table */
upper = 300; /* upper limit */
step = 20; /* step size */
*fahr = lower;
while(*fahr <= upper){
celsius = 5 * (*fahr - 32) / 9;
printf("%d\t%d\n", *fahr, celsius);
*fahr = *fahr + step;
}
}
Purify를 이용해 이 프로그램을 분석하기 위해, 링크 커맨드 앞에 purify를 추가함으로써 프로그램에 삽입을 합니다. Purify 분석 메세지를 상세화하기 위해서 -g 옵션을 추가할 수 있습니다:
purify gcc [-g] conv.c
그림 1: gcc 컴파일러와 Purify를 이용한 conv.c 프로그램 빌드 및 삽입
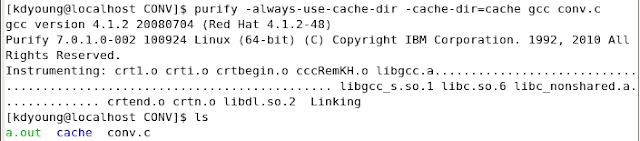
만약 프로그램 컴파일 및 링크를 단계별로 수행할 경우에는 링크 라인에만 purify를 명시합니다:
컴파일 라인: gcc -c [-g] conv.c
링크 라인: purify gcc [-g] conv.o
Rational PurifyPlus for Linux and UNIX에서 지원하는 컴파일러 목록은 아래와 같습니다.
출처: http://www-01.ibm.com/software/awdtools/purifyplus/unix/sysreq/
7.0.1.0-002
Solaris
이제 삽입된 프로그램을 실행하여 결과를 보도록 하겠습니다. 실행 결과가 그림 2처럼 커맨드 라인에 표시되는 동안, Purify는 분석 결과를 그림 3처럼 윈도우에 표시를 합니다.
그림 2: 프로그램 실행 출력 화면
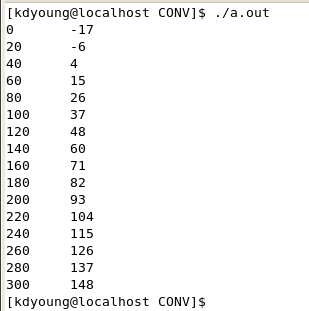
그림 3: 프로그램 실행 분석 화면
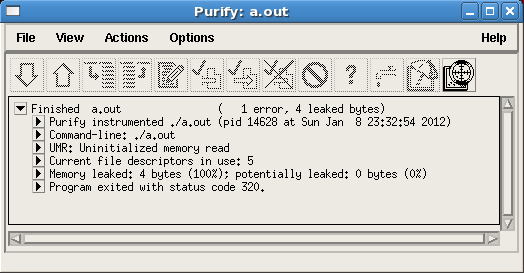
간단한 프로그램 분석을 통해 다음 두가지를 보여주고자 합니다.
(1) 리눅스에 Purify가 제대로 설치되어 있는 지 확인합니다.
(2) 작고 간단한 프로그램이지만 에러가 발생하기가 쉬우며 어떤 수정이 필요한지 보여줍니다.
아래 conv.c는 화씨를 섭씨로 변경하는 C 프로그램으로 Kernighan 및 Ritchie의 The C Programming Language에 예시된 프로그램을 조금 변경한 것입니다.
#include <stdio.h>
#include <stdlib.h>
#include <malloc.h>
main()
{
int *fahr;
fahr = (int *)malloc(sizeof(int));
int celsius;
int lower, upper, step;
celsius = lower + 10;
lower = 0; /* lower limit of temperature table */
upper = 300; /* upper limit */
step = 20; /* step size */
*fahr = lower;
while(*fahr <= upper){
celsius = 5 * (*fahr - 32) / 9;
printf("%d\t%d\n", *fahr, celsius);
*fahr = *fahr + step;
}
}
Purify를 이용해 이 프로그램을 분석하기 위해, 링크 커맨드 앞에 purify를 추가함으로써 프로그램에 삽입을 합니다. Purify 분석 메세지를 상세화하기 위해서 -g 옵션을 추가할 수 있습니다:
purify gcc [-g] conv.c
그림 1: gcc 컴파일러와 Purify를 이용한 conv.c 프로그램 빌드 및 삽입

만약 프로그램 컴파일 및 링크를 단계별로 수행할 경우에는 링크 라인에만 purify를 명시합니다:
컴파일 라인: gcc -c [-g] conv.c
링크 라인: purify gcc [-g] conv.o
Rational PurifyPlus for Linux and UNIX에서 지원하는 컴파일러 목록은 아래와 같습니다.
출처: http://www-01.ibm.com/software/awdtools/purifyplus/unix/sysreq/
| Operating System | Software | Hardware |
|---|---|---|
| Solaris® 10 base through 5/09 Solaris 9 base through 9/05 Solaris 8 base through 2/04 | Sun C/C++ 5.3 through 5.10 GNU gcc/g++ 4.0 through 4.4 GNU gcc/g++ 3.0 through 3.4 | Sun UltraSPARC® |
| Solaris 10 6/06 through 5/09 | Sun C/C++ 5.8 through 5.10 GNU gcc/g++ 4.0 through 4.4 GNU gcc/g++ 3.4 | AMD64™ Intel® 64 |
| RHEL 5 (Server/Desktop) base through 5.4 RHEL 4 (AS/ES/WS) base through 4.8 RHEL 3 (AS/ES/WS) base through U9 SLES 11 base SLES 10 base through SP2 SLES 9 base through SP4 | GNU gcc/g++ 4.0 through 4.4 GNU gcc/g++ 3.2 through 3.4 Intel icc 11.0 Intel icc 10.1 | Intel IA-32 |
| RHEL 5 (Server/Desktop) base through 5.4 RHEL 4 (AS/ES/WS) base through 4.8 SLES 11 base SLES 10 base through SP2 SLES 9 base through SP4 | GNU gcc/g++ 4.0 through 4.4 GNU gcc/g++ 3.2 through 3.4 Intel icc 11.0 Intel icc 10.1 | AMD64 Intel 64 |
| AIX® 6.1 base through TL3 AIX 5L v5.3 TL5 through TL9 | IBM® XL C/C++ 10.1 IBM XL C/C++ 9.0 IBM XL C/C++ 8.0 IBM XL C/C++ 7.0 GNU gcc/g++ 3.4 | IBM POWER4 IBM POWER5 IBM POWER6 |
7.0.1.0-002
Solaris
- Solaris 10 update 8
- Solaris Studio 12.1
- gcc 4.5
- gdb 6.8, 6.9, 7.0, 7.1
- Red Hat Enterprise Linux 5.5 (Server/Desktop)
- SUSE Linux Enterprise Server 10 SP3
- gcc 4.5
- gdb 6.8, 6.9, 7.0, 7.1
- icc 11.1
- AIX 6.1 TL4
- AIX 5.3 TL10, TL11
이제 삽입된 프로그램을 실행하여 결과를 보도록 하겠습니다. 실행 결과가 그림 2처럼 커맨드 라인에 표시되는 동안, Purify는 분석 결과를 그림 3처럼 윈도우에 표시를 합니다.
그림 2: 프로그램 실행 출력 화면
그림 3: 프로그램 실행 분석 화면

탐지된 에러와 누수 정보를 보다 자세히 보려면 그림 4처럼 해당 메뉴항목을 확장합니다. Purify는 문제가 발생한 지점을 자세히 보여줍니다.
그림 4: 문제에 대한 상세 보기 (-g 옵션을 사용하지 않은 경우)
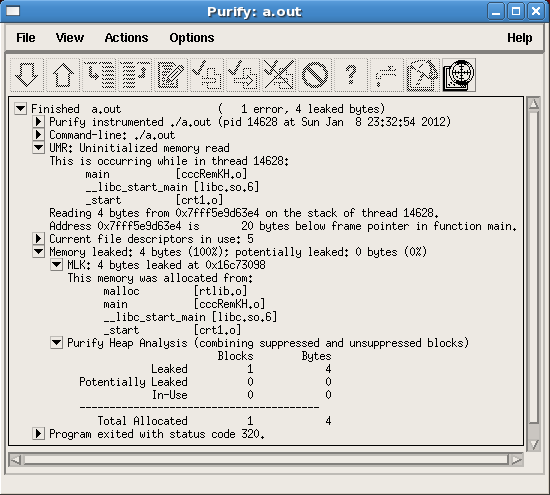
그림 4-1: 문제에 대한 상세 보기 (-g 옵션을 사용한 경우)
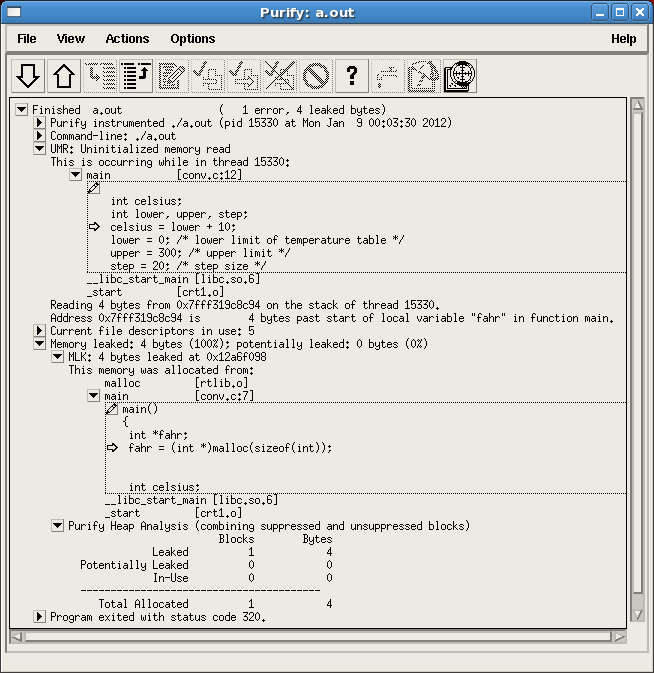
문제 해결에 필요한 도움말이 필요할 경우에는 에러(예 그림 4, "UMR: Uninitialized memory read")를 선택한 후 물음표를 클릭합니다.혹은 Actions 메뉴에서 그림 5처럼 Explain message를 선택합니다.
그림 5: Actions 메뉴의 메뉴 항목

그림 6처럼 UMR 에러 메시지 관련 정보가 나타납니다.
그림 6: UMR 에러 메세지에 대한 설명
도움말을 통해서, Purify가 탐지한 문제에 대한 해결책을 아래 처럼 결정할 수 있습니다:
그림 4: 문제에 대한 상세 보기 (-g 옵션을 사용하지 않은 경우)

그림 4-1: 문제에 대한 상세 보기 (-g 옵션을 사용한 경우)
문제 해결에 필요한 도움말이 필요할 경우에는 에러(예 그림 4, "UMR: Uninitialized memory read")를 선택한 후 물음표를 클릭합니다.혹은 Actions 메뉴에서 그림 5처럼 Explain message를 선택합니다.
그림 5: Actions 메뉴의 메뉴 항목
그림 6처럼 UMR 에러 메시지 관련 정보가 나타납니다.
그림 6: UMR 에러 메세지에 대한 설명
도움말을 통해서, Purify가 탐지한 문제에 대한 해결책을 아래 처럼 결정할 수 있습니다:
- 정의되지 않은 lower 변수 값을 사용하는 celsius 변수에 대한 assignment 라인을 삭제합니다. (celsius assignment 라인을 lower 변수 정의 이후로 옮길 수도 있지만 여기선 그럴 필요가 없습니다) 이는 Purify가 분석한 UMR 문제를 해결합니다.
celsius = lower + 10;
- fahr 변수에 대한 free 함수를 호출하여 fahr 변수에 할당된 메모리를 해제합니다. 이는 Purify가 분석한 메모리 누수 MLK를 해결합니다.
문제를 해결한 뒤, Purify를 다시 적용하여 문제가 처리되었는 지 확인하십시요. 그림 7처럼 문제 해결을 확인할 수 있습니다.
그림 7: 문제 해결 후의 Purify 분석 결과 화면

에러가 해결되었고 메모리 누수를 잡았습니다. 프로그램은 이제 좋은 상태입니다.
그림 7: 문제 해결 후의 Purify 분석 결과 화면
에러가 해결되었고 메모리 누수를 잡았습니다. 프로그램은 이제 좋은 상태입니다.
Linked Data
출처 : http://www.ibm.com/developerworks/rational/library/basic-profile-linked-data/index.html
There is interest in using Linked Data technologies for more than one purpose. We have seen interest in it to expose information -- public records, for example -- on the Internet in a machine-readable format. The IBM® Rational® team has been using Linked Data as an architectural model and implementation technology for application integration.
We would like to share information about how we are using these technologies, the best practices and anti-patterns that we have identified, and the specification gaps that we have had to fill. These best practices and anti-patterns can be classified according to (but are not limited to) the following categories:
The following sections provide details regarding this proposal for a Basic Profile for Linked Data.
Basic Profile Resources
Basic Profile Resources are HTTP Linked Data resources that conform to simple patterns and conventions. Most Basic Profile Resources are domain-specific resources that contain data for an entity in a domain. All Basic Profile Resources follow the rules of Linked Data:
There is interest in using Linked Data technologies for more than one purpose. We have seen interest in it to expose information -- public records, for example -- on the Internet in a machine-readable format. The IBM® Rational® team has been using Linked Data as an architectural model and implementation technology for application integration.
We would like to share information about how we are using these technologies, the best practices and anti-patterns that we have identified, and the specification gaps that we have had to fill. These best practices and anti-patterns can be classified according to (but are not limited to) the following categories:
- Resources
- Containers
- Paging
- Validation
The following sections provide details regarding this proposal for a Basic Profile for Linked Data.
Basic Profile Resources
Basic Profile Resources are HTTP Linked Data resources that conform to simple patterns and conventions. Most Basic Profile Resources are domain-specific resources that contain data for an entity in a domain. All Basic Profile Resources follow the rules of Linked Data:
- Use URIs as names for things.
- Use HTTP URIs so that people can look up those names.
- When someone looks up a URI, provide useful information, using the standards (RDF*, SPARQL).
- Include links to other URIs so that people can discover more things.
- Basic Profile Resources are HTTP resources that can be created, modified, deleted and read using standard HTTP methods.
Basic Profile Resources are created by HTTP POST (or PUT) to an existing resource, deleted by HTTP DELETE, updated by HTTP PUT or PATCH, and "fetched" using HTTP GET. Additionally, Basic Profile Resources can be created, updated, and deleted by using SPARQL Update. - Basic Profile Resources use RDF to define their states.
The state of a Basic Profile Resource (in the sense of state used in the REST architecture) is defined by a set of RDF triples. Binary resources and text resources are not Basic Profile Resources since their states cannot be easily or fully represented in RDF. XML resources might or might not be suitable as Basic Profile Resources. Some XML resources are really data-oriented resources encoded in XML that can be easily represented in RDF. Other XML documents are essentially marked up text documents that are not easily represented in RDF. Basic Profile Resources can be mixed with other resources in the same application. - You can request an RDF/XML representation of any Basic Profile Resource.The resource might have other representations, as well. These could be other RDF formats, such as Turtle, N3, or NTriples, but non-RDF formats such as HTML and JSON would also be popular additions, and Basic Profile sets no limits.
- Basic Profile clients use Optimistic Collision Detection during update.
Because the update process involves getting a resource first, and then modifying it and later putting it back on the server, there is the possibility of a conflict (for example, another client might have updated the resource since the GET action). To mitigate this problem, Basic Profile implementations should use the HTTP If-Match header and HTTP ETags to detect collisions. - Basic Profile Resources use standard media types.
Basic Profile does not require and does not encourage the definition of any new media types. A Basic Profile goal is that any standards-based RDF or Linked Data client be able to read and write Basic Profile data, and defining new media types would prevent that in most cases. - Basic Profile Resources use standard vocabularies.
Basic Profile Resources use common vocabularies (classes, properties, and so forth) for common concepts. Many websites define their own vocabularies for common concepts such as resource type, label, description, creator, last modification time, priority, enumeration of priority values, and so on. This is usually viewed as a good feature by users who want their data to match their local terminology and processes, but it makes it much harder for organizations to subsequently integrate information in a larger view. Basic Profile requires all resources to expose common concepts using a common vocabulary for properties. Sites can choose to additionally expose the same values under their own private property names in the same resources. In general, Basic Profile avoids inventing property names where possible. Instead, it uses ones from popular RDF-based standards, such as the RDF standards themselves, Dublin Core, and so on. Basic Profile invents property URLs where no match is found in popular standard vocabularies. - Basic Profile Resources set rdf:type explicitly.
A resource's membership in a class extent can be derived implicitly or indicated explicitly by a triple in the resource representation that uses the rdf:type predicate and the URL of the class or derived implicitly. In RDF, there is no requirement to place an rdf:type triple in each resource, but this is a good practice, because it makes a query more useful in cases where inferencing is not supported. Remember also that a single resource can have multiple values for rdf:type. Basic Profile sets no limits to the number of types a resource can have. - Basic Profile Resources use a restricted number of standard data types.
RDF does not define data types to be used for property values, so Basic Profile lists a set of standard datatypes to be used in Basic Profile.
- Basic Profile clients expect to encounter unknown properties and content.
Basic Profile provides mechanisms for clients to discover lists of expected properties for resources for particular purposes, but it also assumes that any given resource might have many more properties than those listed. Some servers will support only a fixed set of properties for a particular type of resource. Clients should always assume that the set of properties for a resource of a particular type at an arbitrary server might be open, in the sense that different resources of the same type might not all have the same properties, and the set of properties that are used in the state of a resource is not limited to any predefined set. However, when dealing with Basic Profile Resources, clients should assume that a Basic Profile server might discard triples for properties when it has prior knowledge. In other words, servers can restrict themselves to a known set of properties, but clients cannot. When doing an update using HTTP PUT, a Basic Profile client must preserve all property values retrieved by using HTTP GET. This includes all property values that it doesn't change or understand. (Use of HTTP PATCH or SPARQL Update rather than HTTP PUT for updates avoids this burden for clients.) - Basic Profile clients do not assume the type of a resource at the end of a link.
Many specifications and most traditional applications have a "closed model," by which we mean that any reference from a resource in the specification or application necessarily identifies a resource in the same specification (or a referenced specification) or application. In contrast, the HTML anchor tag can point to any resource addressable by an HTTP URI, not just other HTML resources. Basic Profile works like HTML in this sense. An HTTP URI reference in one Basic Profile Resource can, in general, point to any resource, not just a Basic Profile Resource. There are numerous reasons to maintain an open model like HTML's. One is that it allows data that has not yet been defined to be incorporated in the web in the future. Another reason is that it allows individual applications and sites to evolve over time. If clients assume that they know what will be at the other end of a link, then the data formats of all resources across the transitive closure of all links must be kept stable for version upgrade. A consequence of this independence is that client implementations that traverse HTTP URI links from one resource to another should always code defensively and be prepared for any resource at the end of the link. Defensive coding by client implementers is necessary to allow sets of applications that communicate through Basic Profile to be independently upgraded and flexibly extended. - Basic Profile servers implement simple validations for Create and Update.
Basic Profile servers should try to make it easy for programmatic clients to create and update resources. If Basic Profile implementations associate a lot of very complex validation rules that need to be satisfied for an update or creation to be accepted, it becomes difficult or impossible for a client to use the protocol without extensive additional information specific to the server that needs to be communicated outside of the Basic Profile specifications. The recommended approach is for servers to allow creation and updates based on the sort of simple validations that can be communicated programmatically through a Shape (see the Constraints section). Additional checks that are required to implement more complex policies and constraints should result in the resource being flagged as requiring more attention, but should not cause the basic Create or Update action to fail. - Basic Profile Resources always use simple RDF predicates to represent links.
By always representing links as simple predicate values, Basic Profile makes it very simple to know how links will appear in representations and also makes it very simple to query them. When there is a need to express properties on a link, Basic Profile adds an RDF statement with the same subject, object, and predicate as the original link, which is retained, plus any additional "link properties." Basic Profile Resources do not use "inverse links" to support navigation of a relationship in the opposite direction, because this creates a data synchronization problem and complicates a query. Instead, Basic Profile assumes that clients can use queries to navigate relationships in the opposite direction from the direction supported by the
underlying link.
피드 구독하기:
글 (Atom)