2011년 12월 9일 금요일

JAF - HelloJFS

Building HelloJFS 위키

build an application "HelloJFS" using the Jazz Application Frameworks SDK and Jazz Foundation Services.

  • displays the name of the user logging in with a greeting message.
  • designed to demonstrate some of the key capabilities of the Jazz Application Frameworks.

learn the following:
  • Consuming JFS Discovery Service
  • Delegating authentication to Jazz Team Server
  • Consuming JFS Current User Service
  • Consuming JFS Storage Service
  • Consuming JFS Query Service
  • Deploying our sample application 

튜토리얼

  1. Download and Install
  2. setup IDE for development
  3. HelloJFS Application Design
  4. Creating Plug-in Project
  5. Creating REST service and setting application configuration
  6. Making HelloJFS an OAuth Consumer and Delegating Authentication to JTS
  7. Using Current User Service
  8. Storing HelloJFS Resources
  9. Querying HelloJFS Resources
  10. Packaging and Deploying HelloJFS

2011년 12월 8일 목요일

TESTRT - Makefile수정


hello.c로 부터 hello.exe를 만들기

CC = gcc
hello.exe : hello.o
        $(CC) -o hello.exe hello.o
hello.o : hello.c
        $(CC) -c hello.c
clean :
        rm -f hello.exe hello.o

hello.c로 부터 INSTRUMENT된 hello.exe를 만들기

CC = attolcc -keep -mempro -block=logical -- gcc
hello.exe : hello.o
        $(CC) -o hello.exe hello.o
hello.o : hello.c
        $(CC) -c hello.c
clean :
        rm -f hello.exe hello.o hello_aug.c hello.i hello.c.tsf hello.c.fdc TP.o products.h

2011년 12월 7일 수요일

TESTRT - 메모리 프로파일링


low level of mempro options:
--atp_reports_fiu=0
--atp_reports_sig=0
--atp_reports_ffm_fmwl=0
--atp_reports_abwl=0
--atp_no_track_allocs_before_init
--atp_keep_content
--atp_dump_block_only_once
--linenumoptim


Memory profiling for C/C++ with IBM Rational Test RealTime

현재의 메모리 프로파일을 분석하고 나면, 에러 및 경고 관련된 정보를 제공합니다.
메모리 프로파일에서 식별하는 에러는 아래와 같습니다:
  • FFM (freeing freed memory) -- 응용이 이미 해제한 메모리를 다시 해제하려합니다. 
  • FUM (freeing unallocated memory) -- 응용이 할당받지 않은 메모리를 해제하려합니다. 
  • ABWL (array bounds write, late detect) -- 배열의 경계가 깨졌음을 탐지했습니다. 
  • FMWL (free memory write, late detect) -- 응용이 이미 해제한 메모리에 쓰기를 하려합니다. 
  • MAF (memory allocation failure)
메모리 프로파일에서 식별하는 경고는 아래와 같습니다:
  • MLK (memory leak) -- 할당받은 메모리 블록에 대한 참조를 찾을 수 없어서, 메모리 누수로 판정합니다. 
  • MPK (potential memory leak) -- 할당받은 메모리 블록에 대한 참조는 찾을 수 있지만, 참조가 블록의 맨앞부분이 아닌 중간 어딘가를 가리키고 있습니다. 
  • MIU (memory in use) -- 할당받고 해제되지 않은 모든 메모리 블럭을 나열하고 각 블록에 대한 참조를 찾을수 있습니다. 
코드삽입(instrumentation) 단계동안, 응용 소스파일은 맨 먼저 전처리(preprocess)되고 새로운 임시 소스파일을 만듭니다. 전처리된 소스파일은 이후 툴의 루틴 호출을 포함한 코드가 삽입됩니다. 만약 응용의 소스코드에 메모리 할당/해제 문장 예를 들어 malloc 또는 free  등은 래쇼날 유틸리티 _atp_malloc과 _atp_free로 대체되어 호출됩니다. 이를 통해 툴은 힙(heap)으로 부터 할당된 모든 메모리를 추적할 수 있습니다. (만약 TestRealTime 설치했다면 _atp_malloc 구현부분을 ../Test RealTime/Targets/여러분의TDP/lib/atp.c에서 확인할 수 있습니다.) 마찬가지로, 만약 C++ 응용 코드에서 new 또는 delete 문장을 사용한다면, 래쇼날 유틸리티에서 오버로딩(overload)된 new와 delete 연산자(operator)로 대체됩니다.


응용이 힙(heap)으로 부터 새로운 블록을 할당할때 마다, 툴은 해당 블록에 대한 정보를 해시 테이블(hash table)에 저장합니다. 나중에 메모리 분석시에 해시 테이블에 저장된 메모리 블럭의 주소값을 다음 영역에서 검색을 합니다:
  • 각 쓰레드(thread)나 태스크(task)의 스택(stack) 데이터 
  • 글로벌(global)과 정적(static)에서 할당한 데이터 
  • 그 밖의 힙(heap)에서 할당받은 블럭 
만약 할당받은 메모리블럭에 대한 주소를 위 영역에서 찾을 수 없으면, 해당 블럭은 "누수"로 판정합니다


응용이 성공적으로 빌드되고 나면, 타겟으로 배포를 하고, 여느때처럼 실행을 합니다. 예를 들어 타겟에 대해 일상적인 회귀 시험을 할 수 있습니다. 실행동안 캡처한 데이터는 가능한 수단을 통해 호스트로 전송합니다. 예를 들어 만약 타겟에 파일 시스템이 있고 FTP 서비스를 지원한다면, FTP를 통해 파일을 전송할 수 있습니다. 혹은 디버거를 통해 전송할 수도 있습니다. 여러가지 가능한 방법 중에서 가장 적합한 방법을 활용하여 데이터를 호스트로 전송합니다. 호스트에 데이터를 파일로 전송한 이후에는 후처리(postprocess)를 하여 상세 보고에 필요한 정보를 생산해 냅니다.

TESTRT - 덤프코드


덤프코드 삽입 위치

덤프코드 호출시 다른 쓰레드는 호출하지 않는 함수에 덤프코드를 삽입해야 합니다.
그리고 -DUMPINCOMING= is the list of function entry that start the dump by calling atl_obstool_dump에 지정된 함수는 같은 thread에서 수행되어야 합니다.

% 주의 : mutex 함수는 INSTRUMENT하면 안됩니다.


덤프코드 삽입 방법

1) TESTRT INSTRUMENTER로 하여금 덤프코드를 삽입하는 방식으로 TESTRT INSTRUMENTATION될때만 실행할 수 있는 장점을 제공합니다.
(링크시점에 INSTRUMENTER는 TP.c[pp]를 컴파일하고 TP.o를 링크합니다.)
  • #pragma attol insert printf("BEGIN -- TESTRT DUMP \n");
  • #pragma attol insert _ATCPQ_DUMP(1)
  • #pragma attol insert printf("END -- TESTRT DUMP \n");

2) 내가 직접 덤프함수를 호출하는 방식으로 TESTRT INSTRUMENTER를 실행하지 않는 소스코드에 삽입을 해야 할때 사용할 수 있는 방식입니다.
(보통 링크시점에 INSTRUMENTER는 TP.c[pp]를 컴파일하고 TP.o (_atl_obstools_dump 정의)를 링크합니다.)
  • extern void _atl_obstools_dump(int);
  • _atl_obstools_dump(1);

TESTRT - 시스템헤더 제외 INSTRUMENT 옵션

You can either use the --sys_include=<dir> in the TDP  if the file is a system or third party include file. (atl.out 파일에 추가됨)

  • Basic Settings에 STD_INCLUDE에 추가하는 방법
  • Parser Settings의 Analyzer file configuration에 추가하는 방법
  • (TDP수정없이) atl.out에 직접 추가하는 방법 (TDP 수정시 제거됨)

Or you can use the option -noinstrdir=<dir> to exclude all the files in a particular directory.

Or you can use the option -EXFILE=<file> to exclude one particular file.

Multi-threaded options in for Runtime Analysis and Component Testing
  • Use the option, --no_sys_include, if the application includes system files, such as windows.h or pthread.h.

2011년 12월 5일 월요일

SCM - 체크인 히스토리(check-in history) 체인지셋 히스토리

RTC 3.x가 체인지셋 히스토리(change-set history)를 개발자에게 제공하였다면, RTC 4.0에서 부터는 추가적으로 체크인 히스토리(check-in history)를 개발자에게 제공합니다.

- 개발자는 동일한 체인지셋에 체크인을 여러번 하면서 버전 관리를 할 수 있습니다.
- 즉 기존의 체인지셋 단위 버전 불러보기(load) 보다 세밀하게 하나의 체인지셋에 여러번 체크인한 경우, 체크인 버전별로 파일을 불러올(load) 수 있습니다.

Check-in History shows a file was checked-in multiple times before the change set was completed

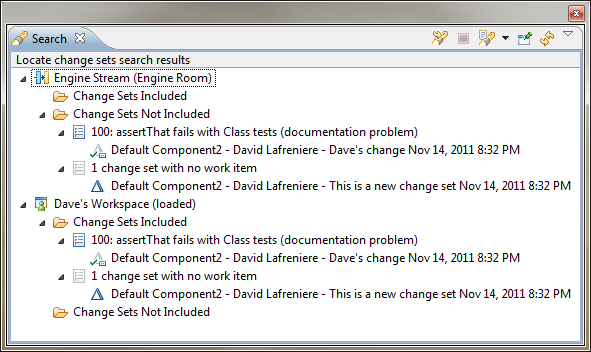
SCM - 결함이 반영되었는 지 검색(locate a change set)

1. 결함을 fix한 change set이 결함에 링크되어 있는 경우에 결함으로 부터 locate a change set를 실행합니다.

Locate change sets action is now available for a work item

2. 해당 결함이 여러개의 change set과 결함 하위에 여러 타스크 작업이 있는 경우에는, 검색할 change set를 선택합니다.

2 streams don't contain the changes, one stream contains some of them

3. 이제는 결함에 관련된 change set이 반영되었는 지 검색 대상을 지정합니다. 스트림이 주 타겟이 될 수 있습니다. 즉 릴리즈 3.0 스트림에 반영되었는 지, 릴리즈 2.1 릴리즈 2.2 등에 백포팅되었는 지 등을 알아보기 위해 해당 스트림을 검색 대상으로 지정합니다.

Hierarchical view

4. 검색결과를 통해 반영된 change set과 반영되지 않은 change set를 살펴보고 조치를 취합니다.

search_view.png